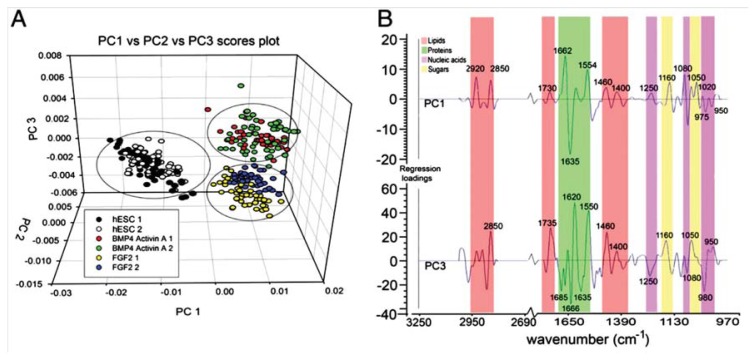
Figure 5.
(A) Scores plots for PLS-DA of the spectral data for the three treatment groups from one experiment showing replicate samples for each cell type. Each spectrum is represented as a point in PC1 vs. PC2 vs. PC3 space; (B) Regression coefficient plots used to explain the clustering observed in the PLS scores plot shown in panel A. PC1 regression coefficient loadings indicated spectral differences explaining clustering along PC1, which separates hESCs from the cells differentiated in FGF2 or BMP4/Act A. PC3 regression coefficient loadings explained the separation of the spectra from FGF2-and BMP4/Act A-treated sample groups along PC3. Limited spread in the PC2 direction did not contribute significantly to the clustering of samples [32].

