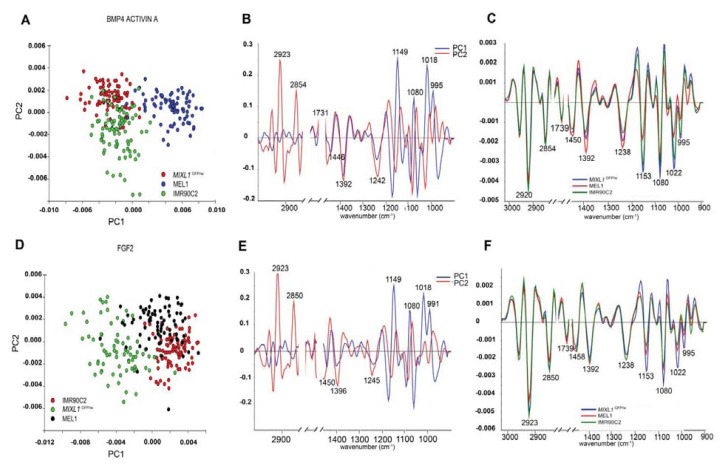
Figure 6.
PCA scores plot (A) loadings plot (B) and average second derivative spectra plot (C) for spectra from the hESC lines MIXL1GFP/w, MEL1 and the hIPSC line IMR90C2 treated with BMP4/ACTIVIN A acquired using FPA-FTIR microspectroscopy. PCA scores plot (D) loadings plot (E) and average second derivative spectra plot with the highest standard deviation across all of the spectra displayed (F) for spectra from the hESC lines MIXL1GFP/w and MEL1and the hIPSC line IMR90C2 treated with FGF2 acquired using FPA-FTIR microspectroscopy [36].

