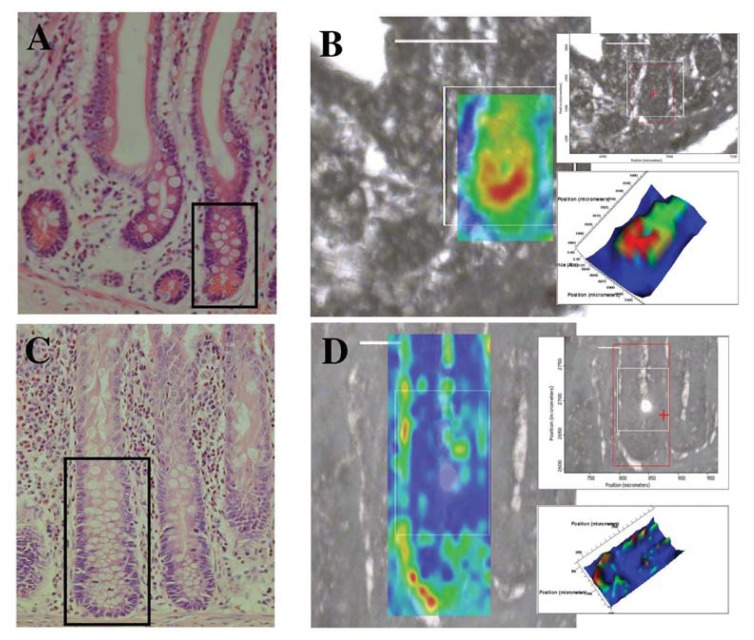
Figure 7.
Localization of the putative stem cell region in an IR spectral image (resolution = 10 μm × 10 μm) map of human GI crypts using synchrotron FTIR microspectroscopy. (A) A section of small intestine tissue stained with H & E post-interrogation with synchrotron FTIR microspectroscopy—the imaged area is designated by the black box; (B) a two-dimensional map of a small intestine crypt, smoothed at wavenumber 1080 cm−1 and superimposed on the unstained region analyzed—see inset. (C) A section of large bowel tissue stained with H & E post-interrogation with synchrotron FTIR microspectroscopy—the imaged area is designated by the black box. and (D), a two-dimensional map of a large bowel crypt, smoothed at wavenumber 1080 cm−1 and superimposed on the unstained region analyzed—see inset. Absorbance intensity (see insets) is proportional to thermal colour changes: blue (lowest intensity) < green < yellow < red (highest intensity) [8].

