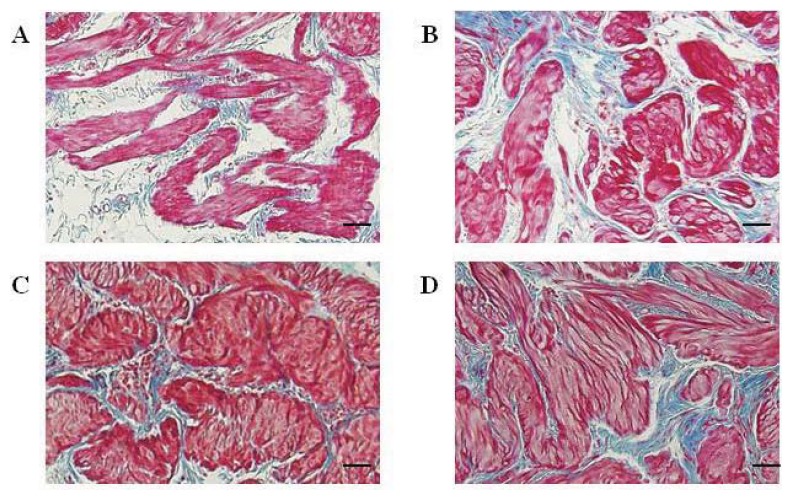
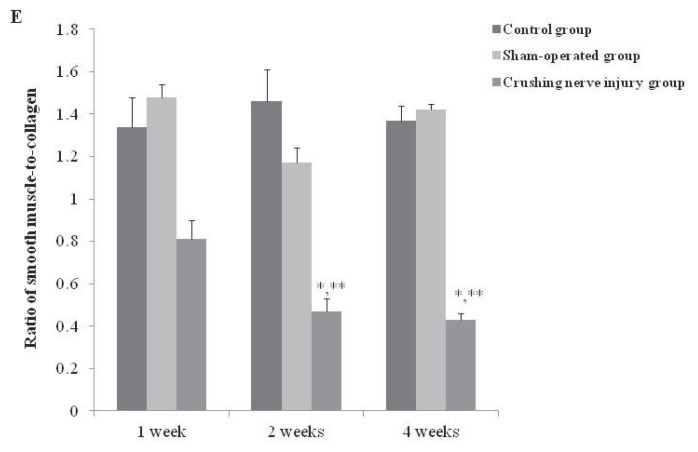
Figure 3.
Distribution of smooth muscle and collagen in detrusor tissue from the bladder in the control and crushing injury on nerve bundles from the MPG to the bladder groups at one, two, and four weeks after injury; Smooth muscle and collagen in detrusor from the bladder of the control (A) and crushing injury on nerve bundles from MPG to the bladder (B) groups at one week after injury; Smooth muscle and collagen in detrusor from the bladder of the crushing injury on nerve bundles from MPG to the bladder groups at two (C) and four (D) weeks after injury; (E) The smooth muscle to collagen ratio in the control, sham-operated, and crushing injury on nerve bundles from the MPG to the bladder group at one, two, and four weeks after injury. The number of rats analyzed at each of one, two, and four weeks after injury was five in the control group, five in the sham-operated group, and 10 in the crushing injury on nerve bundles from MPG group. Results are expressed as mean ± standard deviation of the mean. * p < 0.05 compared with the control group, ** p < 0.05 compared with the sham-operated group. Bar scale = 500 μm.


