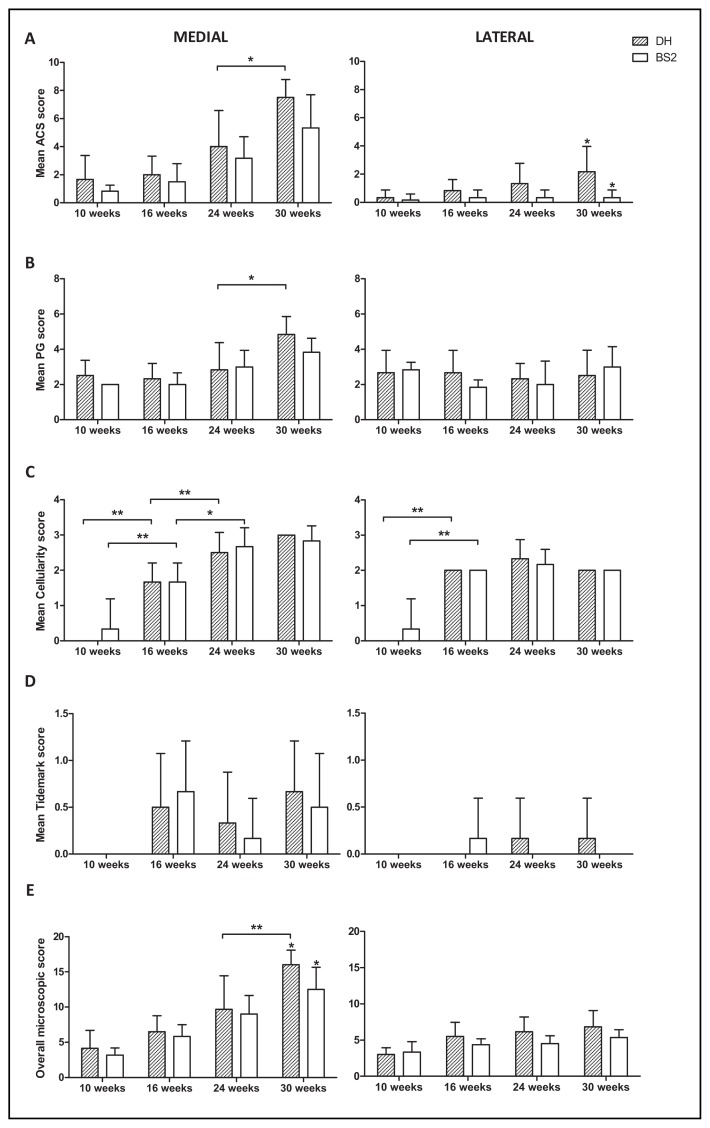
Figure 2.
Microscopic score of the medial and lateral side of DH and BS2 tibial plateau at four different time points. Mean of articular cartilage surface (ACS) scores (A); proteoglycan (PG) (B); cellularity (C); tidemark (D) and overall microscopic score (E) were compared between strains (DH: n = 6; BS2: n = 6 at each time point) and adjacent time points. A significant difference of p ≤ 0.05 and p ≤ 0.01 was denoted as * and **, respectively. Error bars represent the 95% CI.

