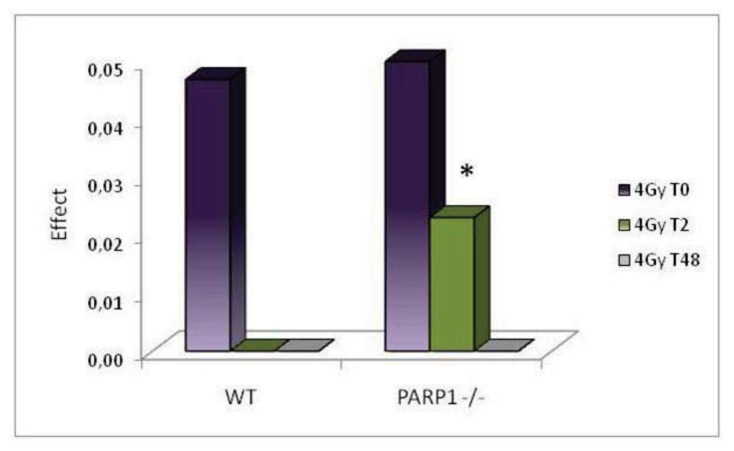
Figure 2.
Differences between the mean fraction tail DNA of irradiated and unirradiated groups (Effect) immediately, 2 and 48 h after irradiation in testis cells of wild-type and PARP1−/− mice. Columns represent the mean values for each experimental group. The asterisk evidences results significantly different from matched controls (* p < 0.05).

