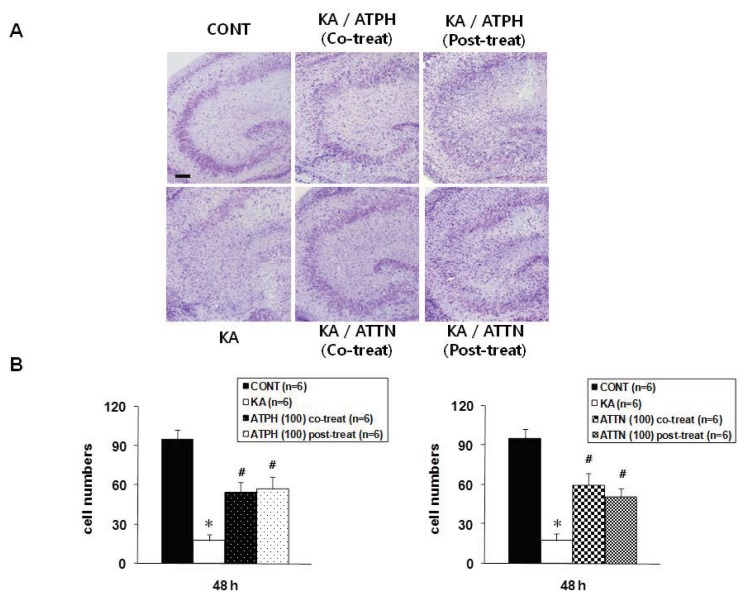
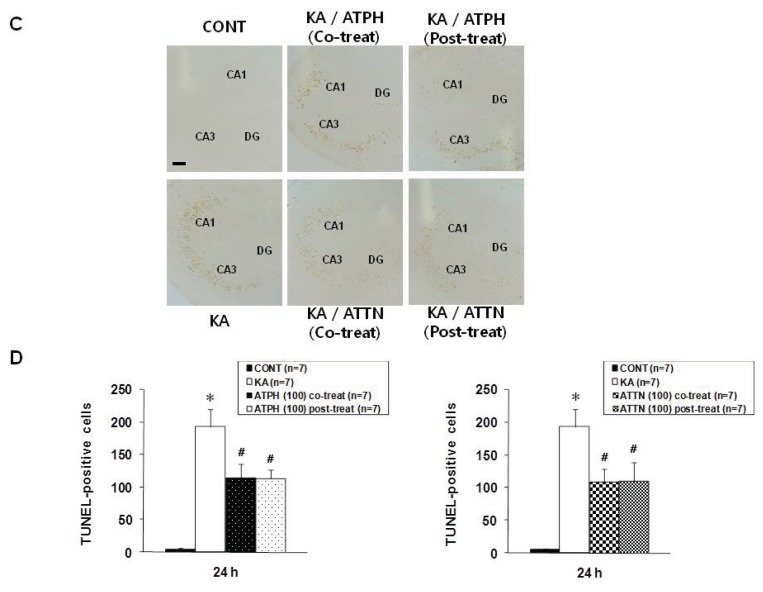
Figure 2.
Cresyl violet and TUNEL staining in the CA3 region of OHSC. Cresyl violet staining was performed at the end of 48 h recovery after KA treatment for 15 h. Representative images from CONT (untreated), KA (5 μM KA only treated), KA/ATPH Co-treat (100 μM ATPH with KA), KA/ATPH Post-treat (100 μM ATPH after KA), KA/ATTN Co-treat (100 μM ATTN with KA), and KA/ATTN Post-treat (100 μM ATTN after KA) slices (A and C). Cresyl violet-positive cells regarded as survival cells and TUNEL-positive cells indicated as apoptotic cell death were quantified in CA3 region (B and D). Data are presented as means ± S.E.M. of 6 experiments for cresyl violet and 5 experiments for TUNEL staining. Asterisks (*) indicate statistically significant difference from control (* p < 0.001 in (B) and * p < 0.001 in (D)); Sharps (#) indicate statistically significant difference from KA-treated cultures (#p < 0.05). Scale bar: 200 μm.


