Figure 3.
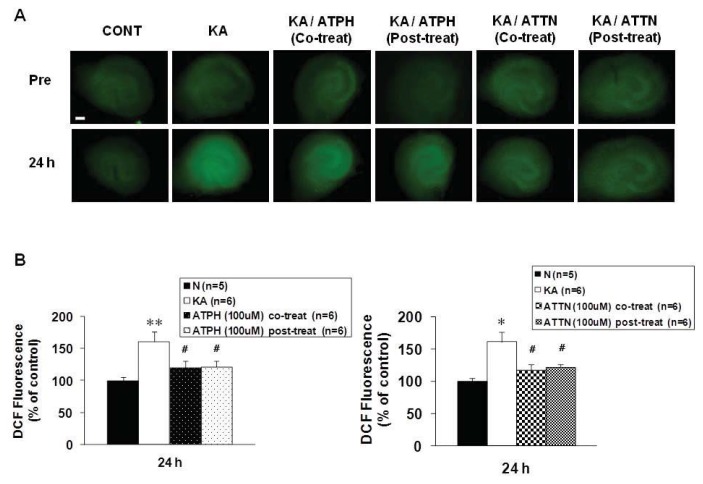
Effects of ATPH and ATTN on KA-induced increase in DCF fluorescence in OHSC. (A) Representative images from CONT (untreated), KA (5 μM KA only treated), KA/ATPH Co-treat (100 μM ATPH with KA), KA/ATPH Post-treat (100 μM ATPH after KA), KA/ATTN Co-treat (100 μM ATTN with KA), and KA/ATTN Post-treat (100 μM ATTN after KA) slices; (B) Quantification of DCF intensity. Data are expressed as percentage of control values and are presented as means ± S.E.M. of 5 to 6 experiments. Asterisks (*) indicate statistically significant difference from control (* p < 0.05, ** p < 0.001); Sharps (#) indicate statistically significant difference from KA-treated cultures (#p < 0.05). Scale bar: 200 μm.

