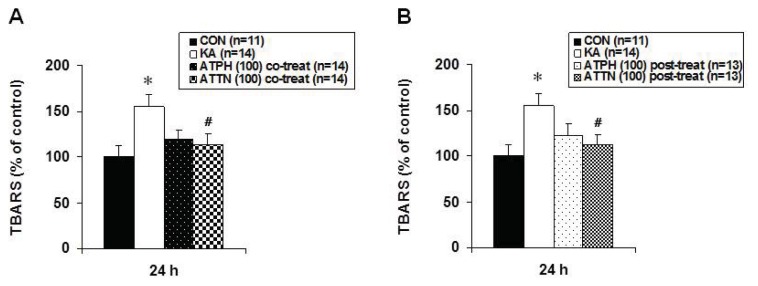
Figure 4.
Effects of ATPH (A) and ATTN (B) on KA-induced increase in lipid peroxidation in OHSC. Lipid peroxidation was measured at 24 h recovery time after drugs treatment by TBARS assay as described in Methods. Results are expressed as percentage of control values and are means ± S.E.M. of 9 to 12 experiments. Asterisks (*) indicate statistically significant difference from control (* p < 0.05); Sharps (#) indicate statistically significant difference from KA-treated cultures (#p < 0.05).

