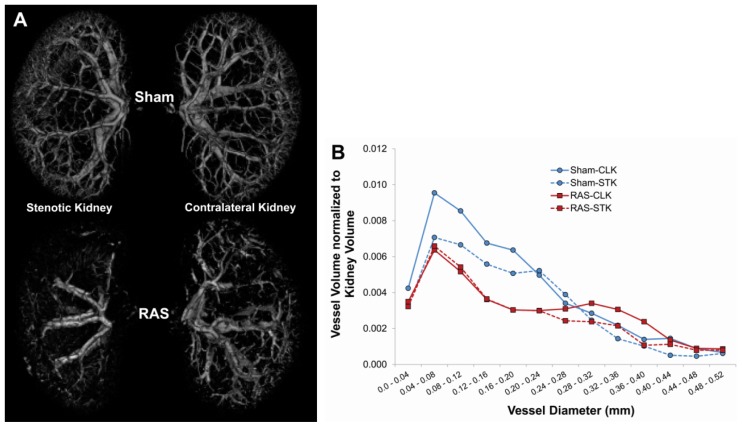
Figure 3.
(A) Representative micro CT images of kidneys from mice with sham (N = 3) and RAS (N = 3) surgery, showing loss of vascular density in both stenotic and contralateral kidneys; (B) Both stenotic (STK) and contralateral (CLK) kidneys of mice subjected to RAS surgery showed loss of microvessel density. Representative figure showed representative distribution of vessels with diameter <0.52 mm in kidneys of mice with sham and RAS surgery. Vessel distribution was calculated as ratio of vessel volume to total kidney volume.

