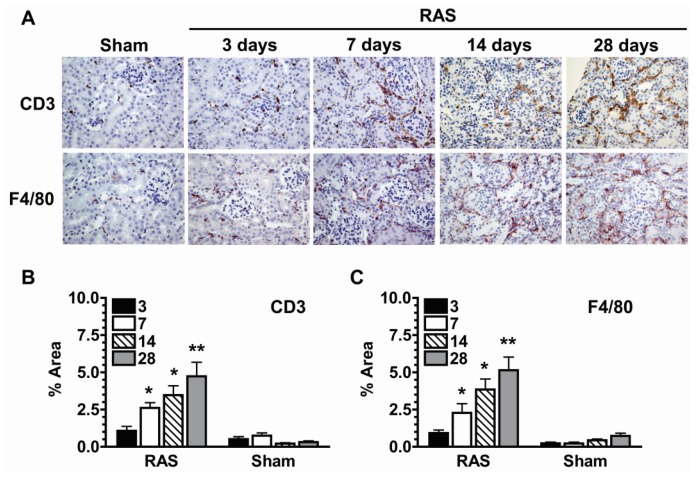
Figure 4.
(A) Representative histological images of stenotic kidney of mice with RAS (N = 10) surgery at 3,7,14, and 28 days post-surgery and mice with sham (N = 5) surgery at three days post-surgery as stained with anti-CD3 (T-cells) and anti-F4/80 (macrophages) antibody. All images were taken at 400×; (B) Extent of T-cell infiltration as assessed by quantifying % area positive for CD3 stains; (C) Extent of macrophage infiltration as assessed by quantifying % area positive for F4/80 stains. Assessments were done at 200× magnification over the whole cortex using color assisted image analysis. *p < 0.05, **p < 0.01 in comparison to sham.

