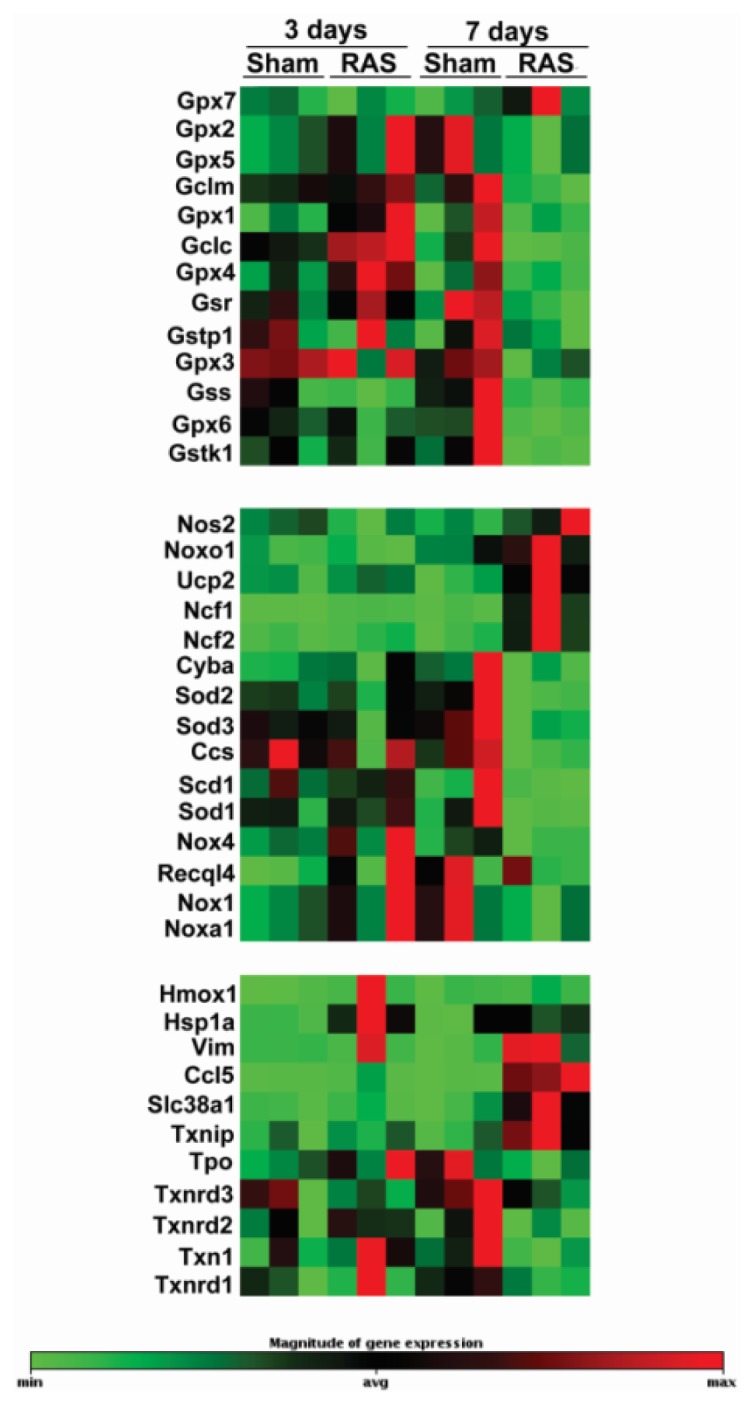
Figure 6.

The clusterograms (heat maps) represent relative expression levels for all samples on genes showing significant changes on Oxidative Stress and Antioxidant Defense PCR Array from SABiosciences. N = 3 for each group.

The clusterograms (heat maps) represent relative expression levels for all samples on genes showing significant changes on Oxidative Stress and Antioxidant Defense PCR Array from SABiosciences. N = 3 for each group.