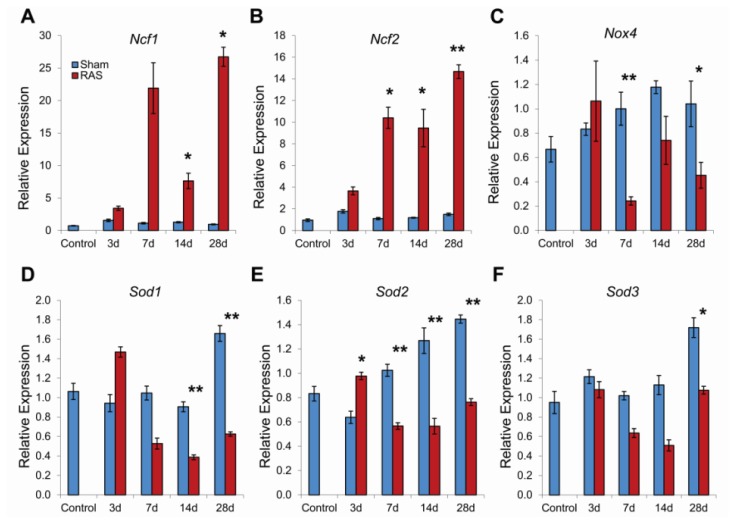
Figure 7.
Kidney gene expression changes in Ncf1 (A), Ncf2 (B), Nox4 (C), Sod1 (D), Sod2 (E), and Sod3 (F) associated with renal artery stenosis (RAS). Data (means ± SE) for each gene was normalized to 18s transcripts and expressed as relative expression compared to the seven day sham. N = 10 for RAS groups at each time points. N = 5 for sham groups at each time points. Control group (N = 5) refers to mice without surgery. *p < 0.05, **p < 0.01 in comparison to sham.

