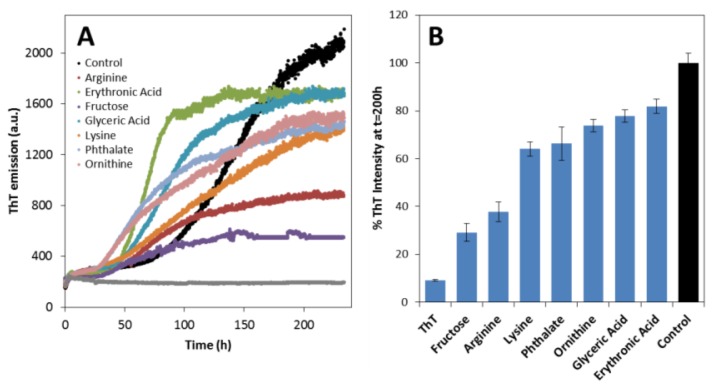
Figure 3.
Metabolites promote aggregation of apoSOD1. (A) Aggregation kinetics of 50 μM apoSOD1 monitored by ThT fluorescence emission, in the absence (black) and in presence (colors) of 200 μM metabolites; (B) Plot of ThT fluorescence intensity at 200 h (from traces in panel A). Both panels are representative of 3 independent measurements with 50 μM apoSOD1 at pH 7.4 under agitation at 37 °C with and without 200 μM of each metabolite. The ThT bar represents the fluorescence intensity of the probe in the absence of protein and metabolites. See experimental section for further details.

