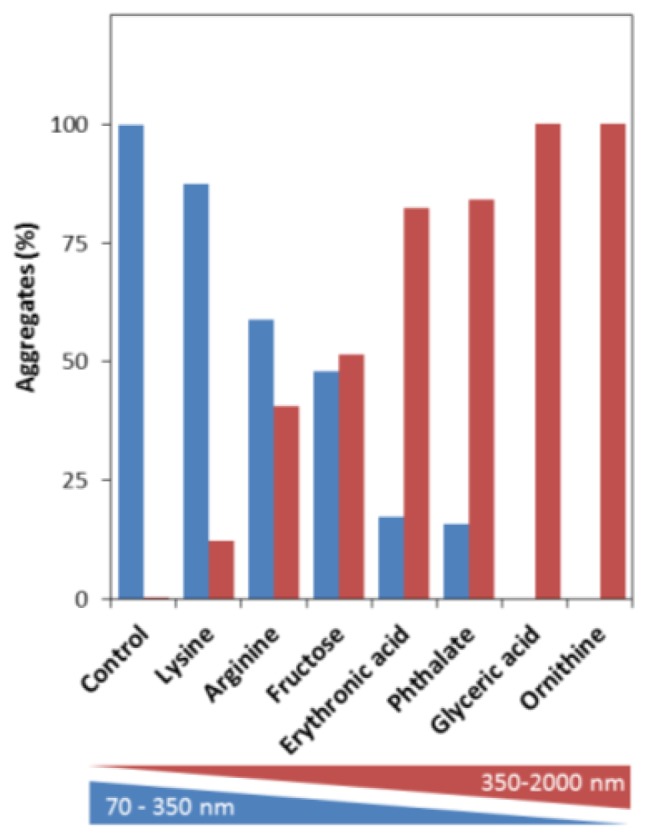
Figure 4.

Metabolites boost the formation of larger apoSOD1 aggregates. Nanoparticle Tracking Analysis (NTA) of the distribution of total apoSOD1 aggregates generated from 50 μM apoSOD1, alone and in the presence of 200 μM of each metabolite after incubation at pH 7.4 under agitation at 37 °C for 200 h (metabolite:protein = 4). Blue bars correspond to the distribution of small aggregates (70–350 nm) and red bars correspond to larger aggregates (350–2000 nm). See experimental section for further details.
