Figure 6.
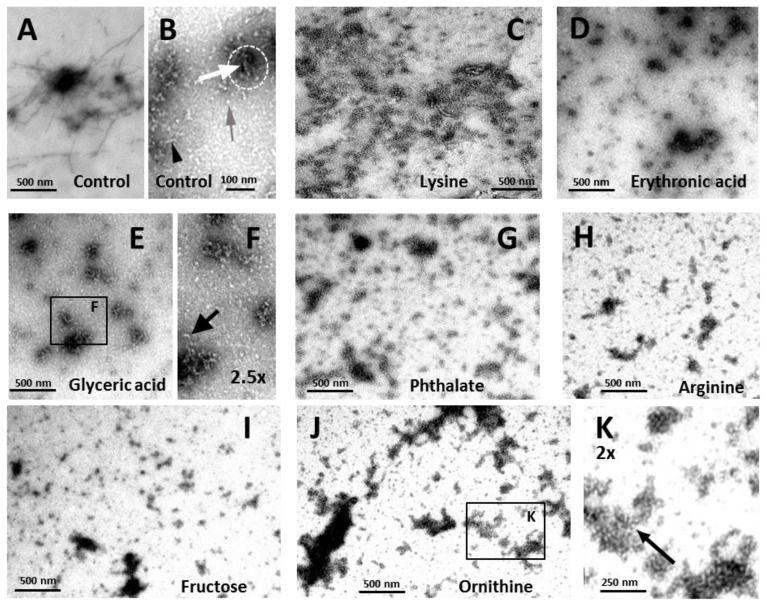
Metabolites modulate the morphology of apoSOD1 aggregates. TEM images of apoSOD1 with or without metabolites at a metabolite:protein ratio of 4, after incubation at pH 7.4 under agitation at 37 °C for 200 h. (A,B) Control, apoSOD1 with no added metabolite; (C) +lysine; (D) +erythronic acid; (E) +glyceric acid; (F) +glyceric acid, magnification of panel E; (G) +phthalate; (H) +arginine; (I) +fructose; (J) +ornithine; (K) +ornithine, magnification of panel J. See experimental section for further details.

