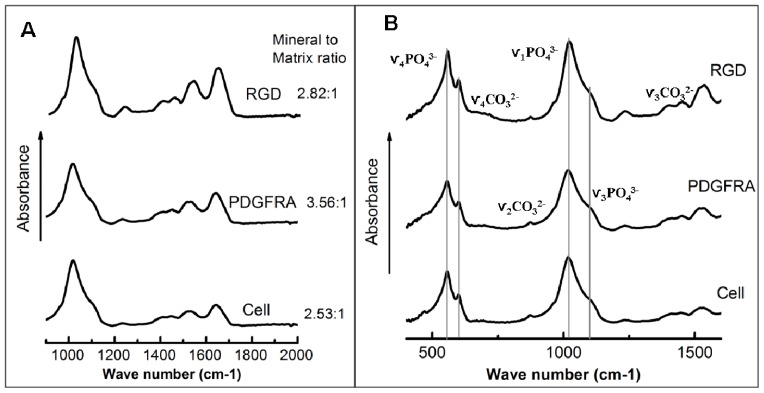
Figure 3.
FTIR spectra obtained before (A) and after (B) thermal gravimetric analysis of mechanical stimulated hMSCs (PDGFRα and RGD treatment) and non-treated hMSCs (Cell) following 3 weeks of culture. In both the PDGFRα treatment (denoted PGFRA in the plot) and RGD treatment (denoted RGD in the plot) groups, hMSCs were incubated with the appropriate antibody-conjugated MNPs and exposed to the MFB for 1 h per day for 3 weeks. The MFB exposure frequency was set as 1 Hz. Medium was changed every other day. The mineral-to-matrix ratio was obtained by integrating the area under the curve between 900 and 1200 cm−1 (ν1, ν3 PO4 band) and dividing by the area under the curve between 1585 and 1725 cm−1 (amide I band) [32].

