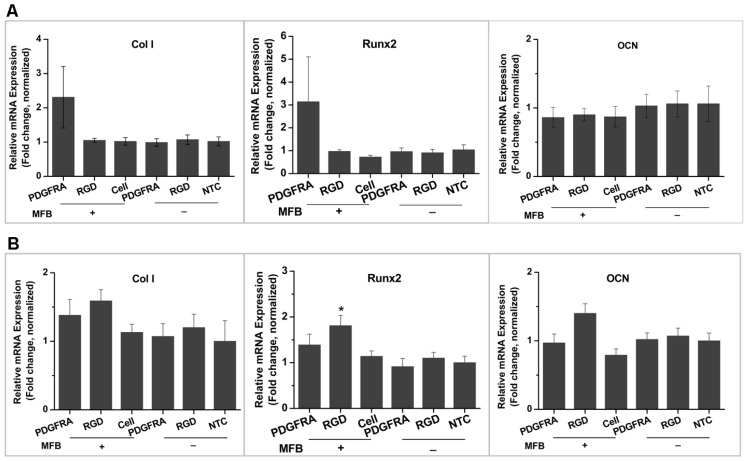
Figure 4.
Osteogenic marker gene expression (relative fold change normalized to each control group) in hMSCs following 3 weeks of exposure to the MFB with cells cultured in (A) proliferation medium and (B) osteogenic medium (n = 3, mean ± SD, *p < 0.05). Experimental and control groups: PDGFRA: cells treated with PDGFRα antibody-conjugated MNPs; RGD: cells treated with RGD-conjugated MNPs; Cells: cells only (with field); NTC: non-treated control; MFB “+”: exposed to magnetic fields; MFB “−”: no field controls.

