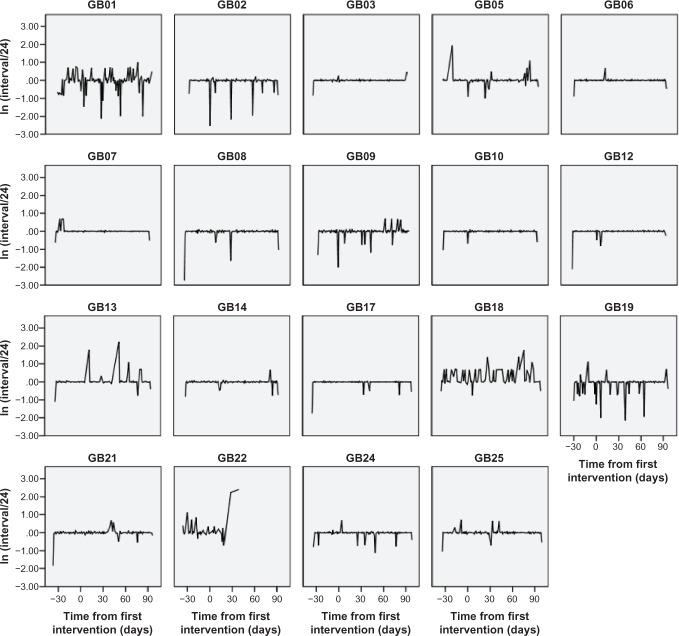
Figure 3.
Individual adherence plots (time between drops).
Notes: Time from first intervention. The ln (Interval/24) axis has been used to aid presentation of the profiles. Observations on the y-axis at zero are perfect adherence (ie, exactly 24 hours since the last medication), while observations away from this line represent loss of adherence.
Abbreviation: GB, group based.

