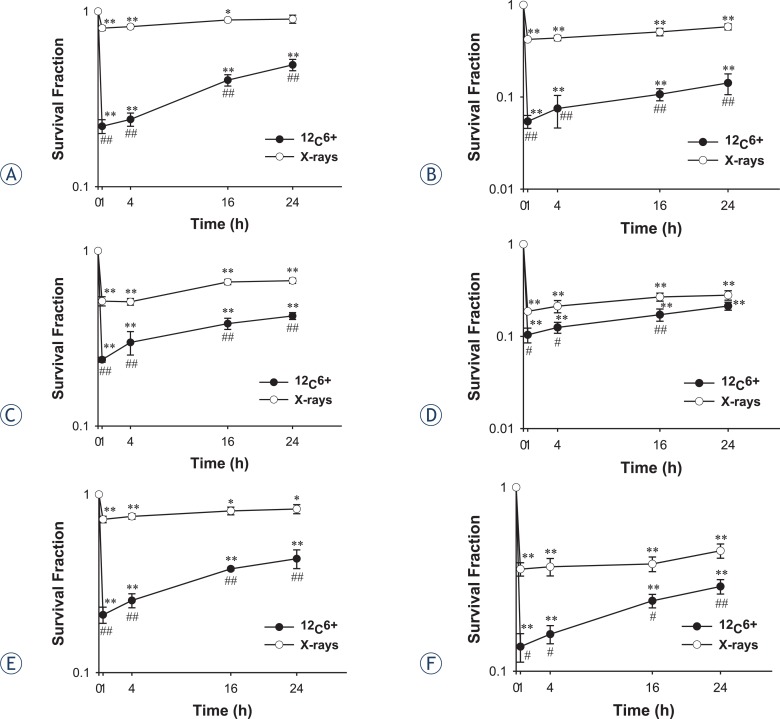
FIGURE 1.
A survival curve for the Hela,HepG2 and MEC-1 cell lines, as determined by clonogenic assay. Exponentially growing cells were plated and irradiated, the cells were taken at the indicated time intervals after irradiation of 12C6+ and X-rays and a clonogenic assay was performed. The means and SD are shown for three independent experiments with 4 replicates in each experiment. Untreated cells served as a control. After incubation for two weeks, colonies with cells greater than 50 were counted (A. Hela-2Gy; B. Hela-4Gy; C. HepG2-2Gy; D. HepG2-4Gy; E. MEC-1-2Gy; F. MEC-1-4Gy.)
*: P<0.05 vs. 0Gy irradiation; **: P<0.01 vs. 0Gy irradiation; #: P<0.05 vs. the same dose x-rays irradiation; ##: P<0.01 vs. the same dose x-rays irradiation.

