
Figure 5. L. lactis under stress.
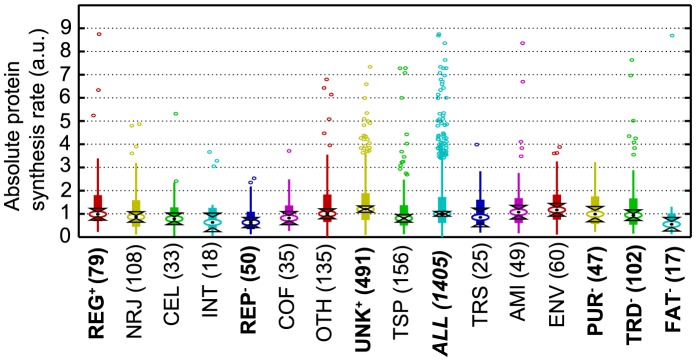
This is the same as Figure 4, but for cells grown under stress condition. The ordering of categories is the same as for Figure 4; categories whose synthesis rate changed significantly between the conditions are marked in bold, with a “+” to indicate an increase and a “−” for a decrease.