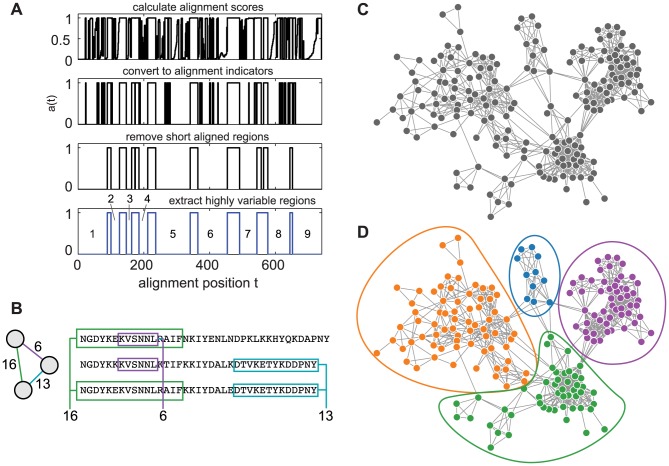
Figure 1. Pictorial overview of sequence analysis method.
(A) Starting from a multiple alignment of the domain of interest, four steps are taken to identify highly variable regions (HVRs), as described in the text. We show the HVR identification process for the 307 DBLα sequences from [18]. (B) For each HVR, a network is made in which each sequence is a node, and a link connecting two nodes corresponds to a shared sequence block. (C) The set of pairwise connections above the noise threshold defines a complex network representing recent recombination events. (D) Communities are inferred directly from this network using a probabilistic generative model. Steps B,C, and D are repeated for each of the HVRs identified in step A.

