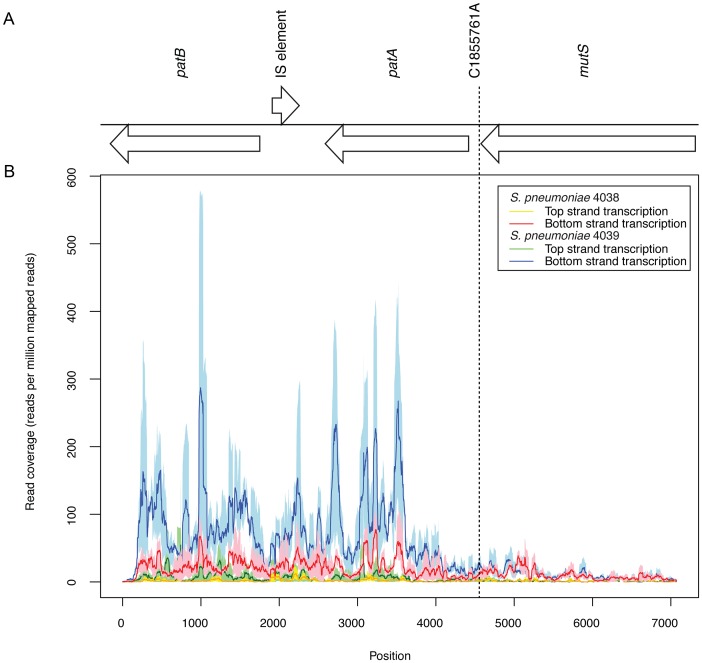
Figure 3. Expression of the patAB locus.
(A) Annotation of the patAB gene cluster, with the intervening IS element remnant on the opposite strand, and the upstream mutS gene. The position of the C1855761A polymorphism distinguishing S. pneumoniae 4038 and 4039 is indicated. (B) Graph showing Illumina read coverage, standardised as a plot of reads mapping per million reads mapped, from RNA-seq experiments. Each line shows the mean value from three replicates surrounded by a shaded area representing the minimum and maximum values. The red and orange lines represent transcription of the two strands of the genome in 4038, and the blue and green lines represent the transcription of the two strands of the genome in 4039.

