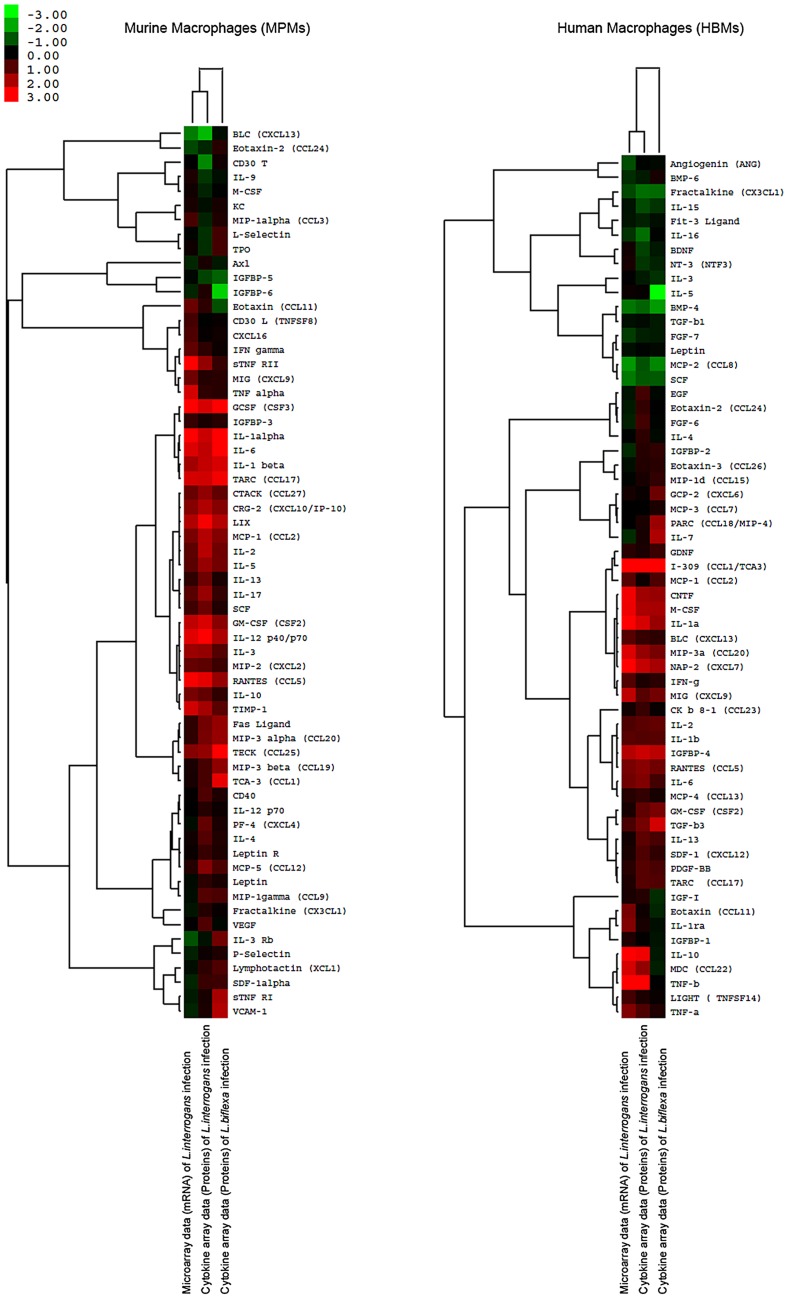
Figure 1. Comparison of cytokine regulation folds of murine peritoneal macrophages (MPMs) and human peripheral blood monocytes (HBMs) at mRNA and protein levels.
Hierarchical cluster analyses of the average microarray data and the average cytokine array data of 62 cytokines of murine peritoneal macrophages (MPMs) and 60 cytokines of human peripheral blood monocytes (HBMs) were performed using Cluster3.0 software and visualized by using TreeView software. MPMs and HBMs were infected by L. interrogans for 4-h or infected by L. biflexa for 4-h, respectively.

