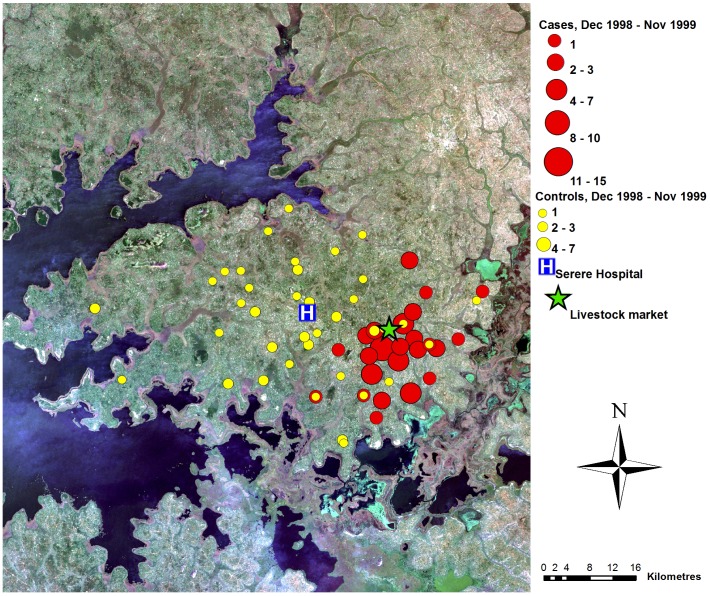
Figure 2. Map of case control data, year 1.
True colour Landsat ETM+ composite of study area, showing locations of cases and controls (as counts for each location), December 1998–November 1999, Serere hospital and Brookes Corner livestock market. Figure adapted from [20].

