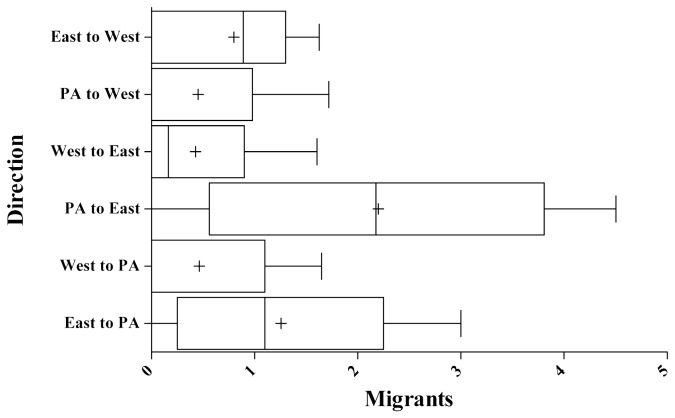
Figure 4. Estimates of gene flow based on Bayesian inferences of migration rates and population sizes.
M is the estimated migration rate, scaled for the appropriate mutation rate between the different population clusters. Box plots represent values from the lower (25%) to upper (75%) quartiles with the median value marked as a +. The lines extend from the 2.5% to 97.5% percentiles.

