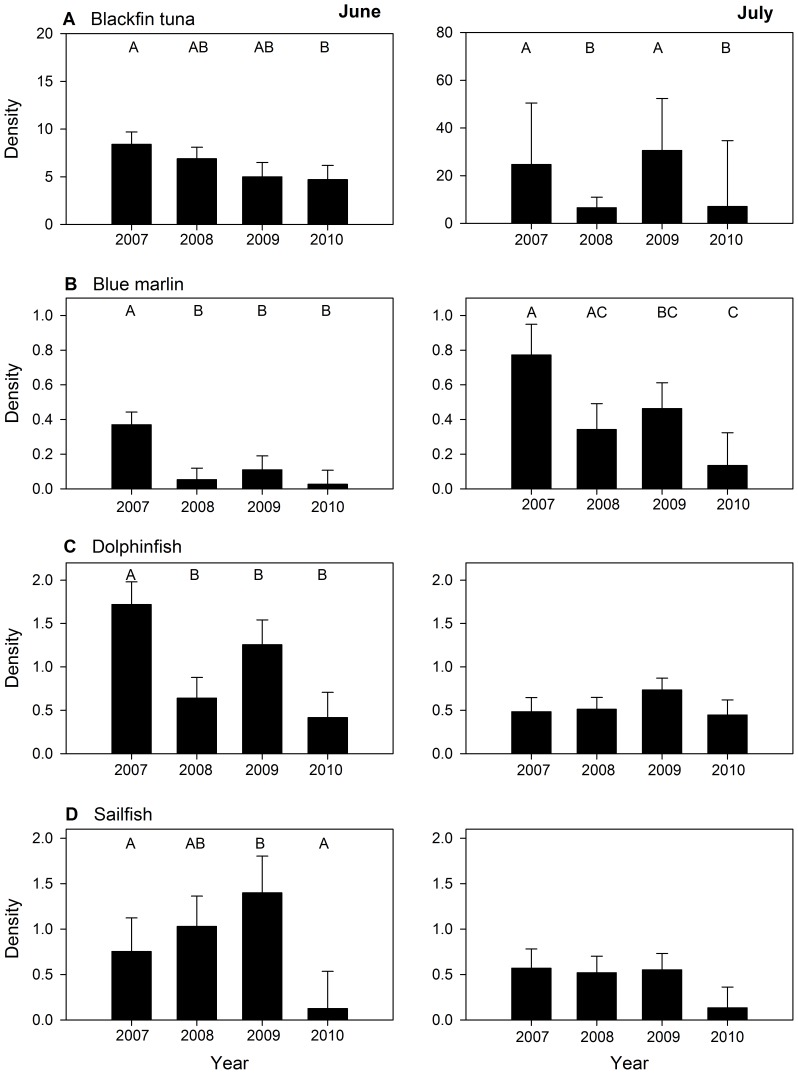
Figure 1. Mean density [larvae ⋅ 1000 m−3 (±1 standard error)] of pelagic fish larvae collected from 2007 to 2010 for A) blackfin tuna (Thunnus atlanticus), B) blue marlin (Makaira nigricans), C) dolphinfish (Coryphaena hippurus), and D) sailfish (Istiophorus platypterus).
Left and right panels represent results for June and July surveys, respectively. Upper case letters on plots represent significant differences based on multiple comparisons with Wilcoxon non-parametric test (p<0.05).

