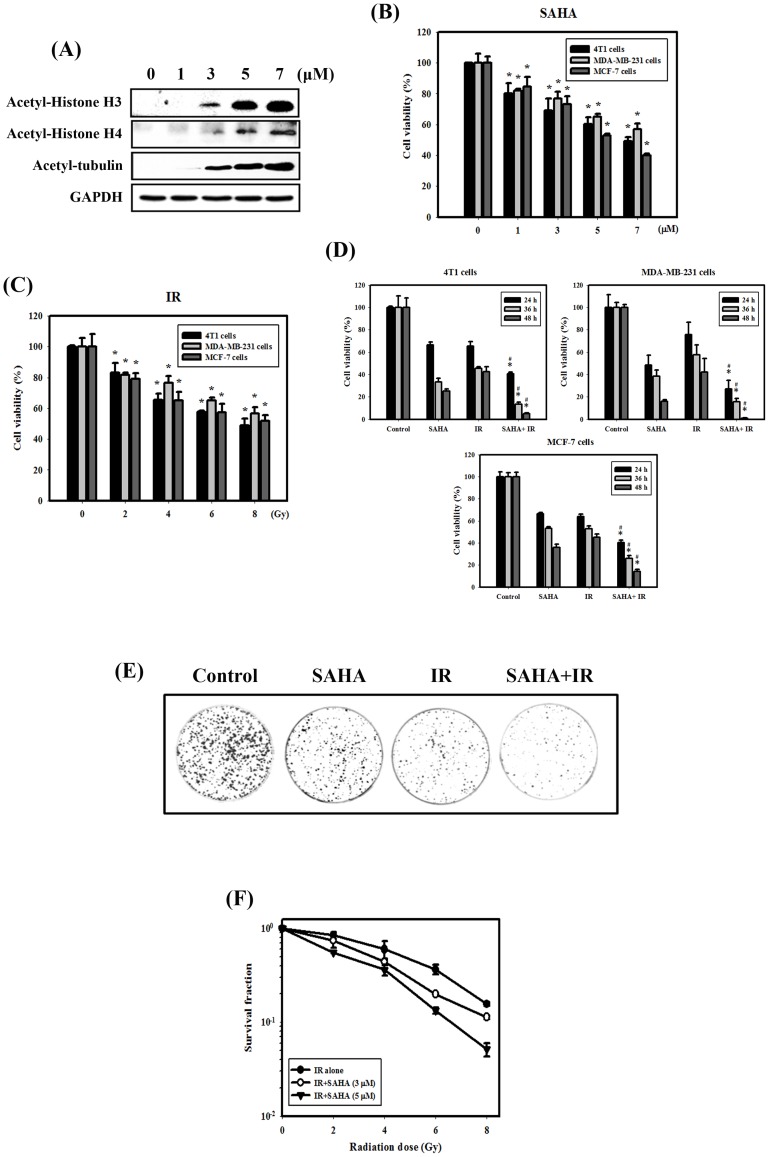
Figure 1. IR dose–response survival curves and cytotoxic effects resulting from SAHA and/or IR treatment in breast cancer cells.
(A) Concentration-dependent effects of SAHA on histone and nonhistone proteins for 24 hrs in 4T1 cells. (B) Concentration-dependent effects of SAHA on the viability of breast cancer cells. Cells were treated with 1, 3, 5 or 7 µM SAHA for 24 hrs. *, p<0.05, SAHA versus control. (C) Dose-dependent effects of IR on the viability of breast cancer cells. Cells were treated with 2, 4, 6 or 8 Gy IR for 24 hrs. *, p<0.05, IR versus control. (D) Cytotoxic effects in cells treated with IR (4 Gy) and/or SAHA (3 µM). #, p<0.05, IR versus combined treatment. *, p<0.05, SAHA versus combined treatment. (E) Clonogenic assay in 4T1 cells treated with IR (4 Gy) and/or SAHA (3 µM). (F) The radiation dose-response survival curves of 4T1 cells with or without SAHA. Data are presented as the mean ± standard deviation of three independent experiments.

