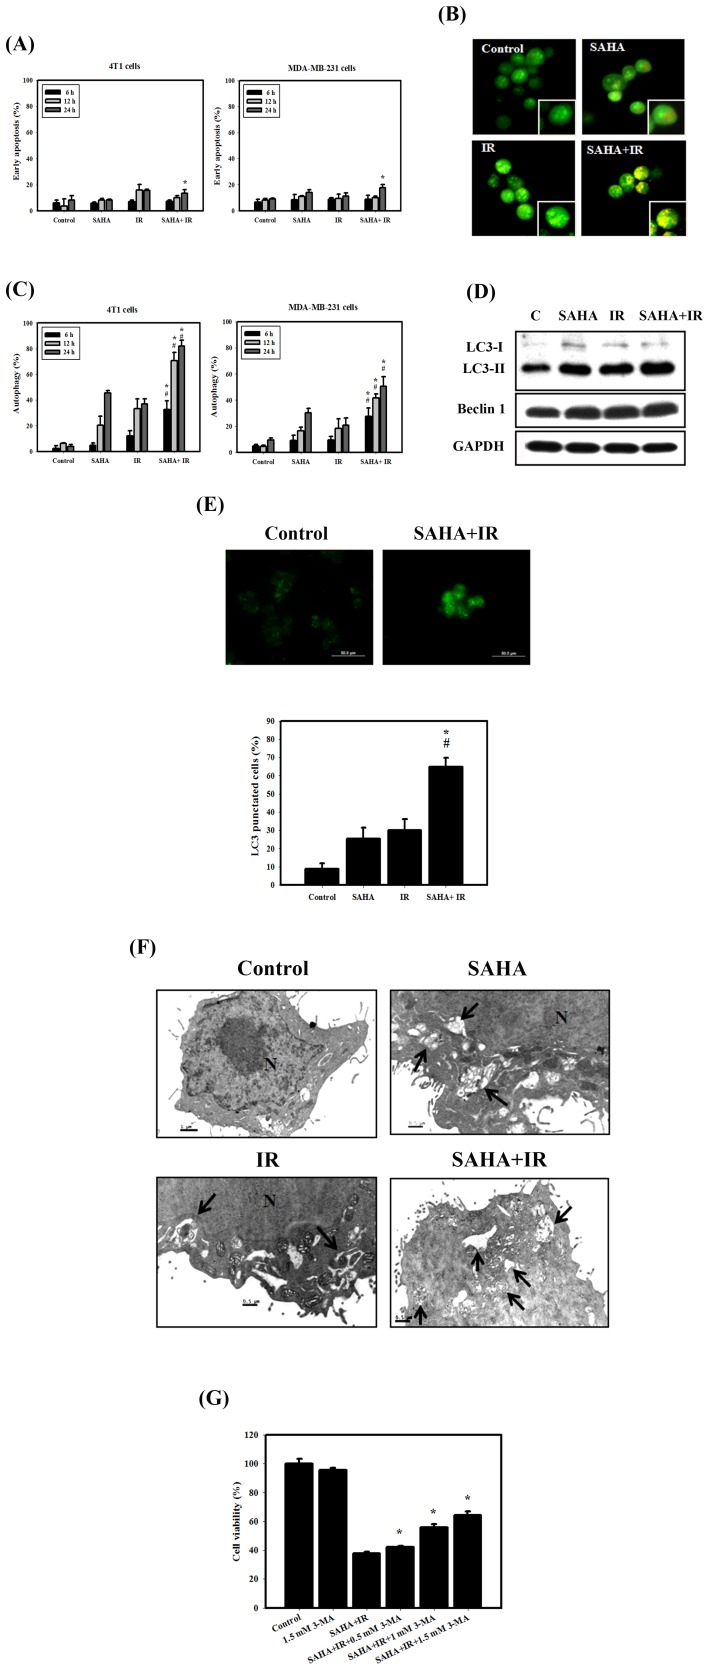
Figure 3. Measurement of apoptosis and autophagy in breast cancer cells that received various treatments.
(A) Early apoptosis, detected using an Annexin V apoptosis detection kit, was measured using flow cytometry. Cells were treated with IR (4 Gy) and SAHA (3 µM) for 6, 12 or 24 hrs. (B) Microphotograph of AVOs in 4T1 cells. Detection of green and red fluorescence in acridine orange (AO)-stained cells was performed using a fluorescence microscope. Cells were treated with IR (4 Gy) and SAHA (3 µM) for 24 hrs. (C) Quantification of AVOs with AO-stained cells treated with IR (4 Gy) or SAHA (3 µM) alone or in combination using flow cytometry. #, p<0.05, IR versus combined treatment. *, p<0.05, SAHA versus combined treatment. (D) Western blotting for LC3-I, LC3-II and Beclin 1 in 4T1 cells. Cells were treated with IR (4 Gy) and SAHA (3 µM) for 12 hrs. (E) Immunofluorescence staining of LC3 protein in 4T1 cells treated with IR (4 Gy) and SAHA (3 µM) for 12 hrs. #, p<0.05, IR versus combined treatment. *, p<0.05, SAHA versus combined treatment. (F) EM microphotographs of 4T1 cells treated with IR (4 Gy) and SAHA (3 µM) for 24 hrs. The black arrows point to autophagic vacuoles and autolysosomes. (G) Cytotoxic effects in the absence or presence of 3-MA. Cells were pretreated with 3-MA for 1 hr before combined treatment. *, p<0.05, combined treatment versus combined treatment +3-MA. Data are presented as the mean ± standard deviation of three independent experiments.

