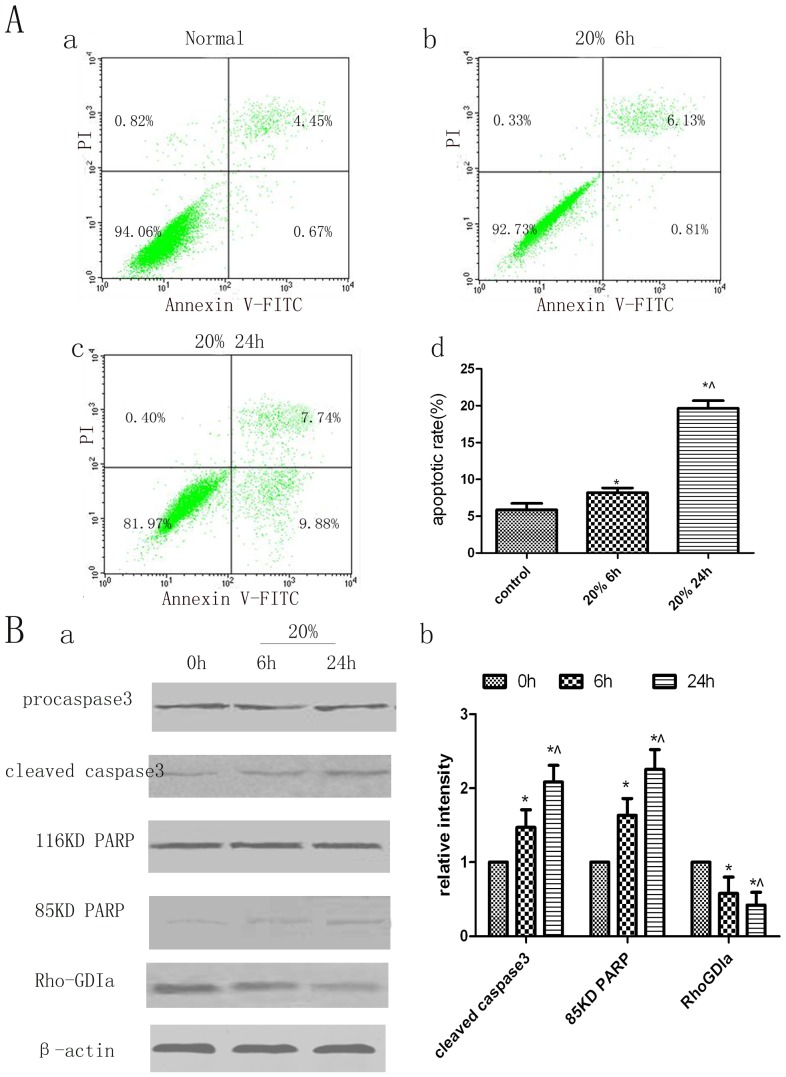
Figure 2. Analysis of apoptosis and protein changes in human PDL cells under pathological cyclic strain.
A. Flow cytometric analysis of apoptosis in human PDL cells stained with annexin V and PI. Dot plots of cells stained with annexin V and PI are shown. The lower right quadrant indicates cells in early stages of apoptosis, and the upper right quadrant indicates cells in late stages of apoptosis. (a) Non-stretched group at 6 h. (b) 20% strain group at 6 h. (c) 20% cyclic strain group at 24 h. (d) Quantitation of apoptotic cells in each group. Bars represent means ± SD of at least three experiments. *p<0.05, static control group vs. 20% cyclic strain group at 6 h and 24 h; ∧ p<0.05, 20% cyclic strain group at 6 h vs. 24 h. B. Western blot analysis of RhoGDIα, caspase-3, and PARP protein levels. (a) Exposure to cyclic stretch correlates with increased levels of cleaved 19-kDa caspase-3 and 85-kDa PARP; the levels of 32-kDa procaspase-3 and 116-kDa PARP proteins remained unchanged, and the RhoGDIα level decreased. (b) Quantitative analysis of the protein levels of RhoGDIα, 85-kDa PARP, and cleaved caspase-3 in cell lysates of human PDL cells exposed to cyclic stretch for 6 and 12 h. Bars represent means ± SD of at least three experiments. *p<0.05, static control group vs. 20% cyclic strain group at 6 and 24 h; ∧ p<0.05, 20% cyclic strain group at 6 h vs. 24 h.

