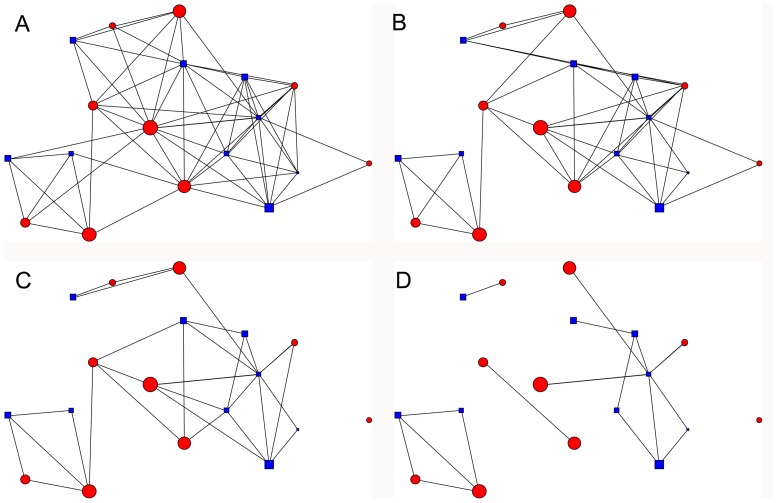
Figure 2. Time censored raccoon association networks (October 2004).
Red circles = females, blue squares = males. Symbol size is scaled to age, with older individuals having larger symbols. Associations between individuals are represented with a line. Each association network is constructed based on the total time spent in proximity per month between individuals: A. monthly dyadic contact time ≥1 min., B. ≥5 min. C. ≥15 min. & D. ≥30 min.

