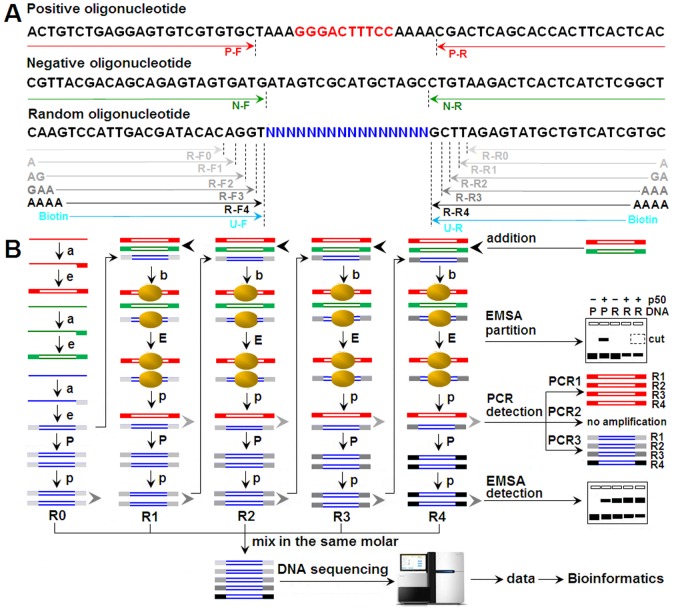
Figure 1. Schematic presentation of SELEX-Seq strategy.
A, Oligonucleotides and PCR primers. The sequences underlined with arrows represented the annealing sites of primers. The bases at the 5′ end of nested primers represented the split barcodes. Biotin-labeled primers were used to prepare the biotin-labeled dsDNAs for NIRF-EMSA. B, EMSA-based SELEX-Seq procedure. The oligonucleotides in red, green and blue represented the positive, negative and random dsDNAs, respectively. PCR1, PCR2 and PCR3 were used to amplify the positive, negative and random dsDNAs with primers P-F/R, N-F/R and S-F1-4/R1-4, respectively. a, annealing; e, elongation; b, binding; p, purification; E, EMSA; P, PCR; R0 to R4, Round 0 to Round 4.

