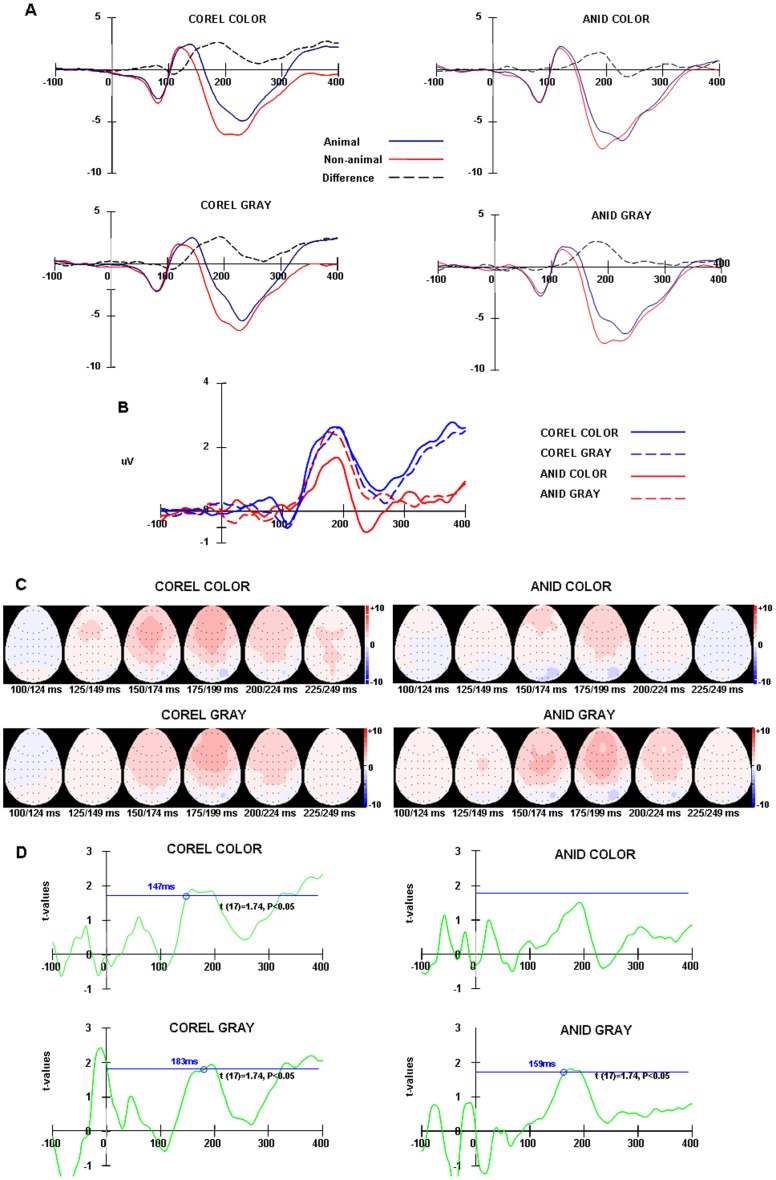
Figure 8. Grand average ERPs of the forced choice task in experiment 2.
(A) Animal and non-animal stimuli ERPs and their difference waveforms of COREL and ANID for color and gray-scale images from frontal areas (FP1, FP2, F3, F4, F7, F8, FZ). (B) The difference waveforms between animal and non-animal stimuli in four conditions. (C) Topographic maps for the difference waves in four conditions: The ERPs were integrated across 20 ms time windows from 120 ms to 259 ms. Maps are viewed from above, with the nose pointing upwards. (D) Paired t-test at each time point of the difference ERPs between −100 ms to 400 ms at frontal areas (n = 18, t (17) = 1.74, p<0.05).

