
Figure 7.
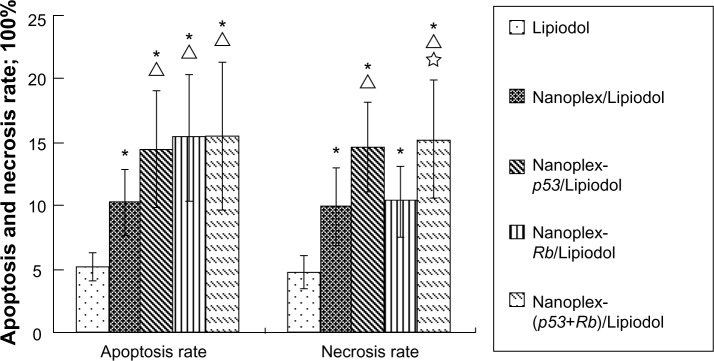
Apoptosis and necrosis rate of tumor cells from different groups.
Notes: * Δ, ▲, and ✰ represent significant difference from Lipiodol® (Guerbet, Villepinte, France) (Group A, n = 10), nanoplex/Lipiodol (Group B, n = 10), nanoplex-p53/Lipiodol (Group C, n = 10), and nanoplex-Rb/Lipiodol (Group D, n = 10), respectively, as calculated with one-way analysis of variance and Fisher’s least significant difference multiple comparison test.