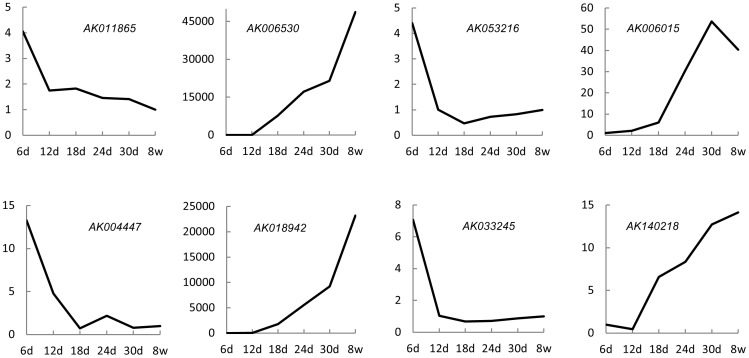
Figure 3. Expression patterns of randomly selected diferentially expressed lncRNAs on different time points of postnatal testis development.
The vertical axis indicates relative expression levels of each lncRNA. The relative expression levels were assessed by Q-PCR and were normalized with GAPDH gene. Each result was the average of three independent biological replicates. The horizontal axis indicates the six time points of postnatal testis development from 6 days (d) to 8 weeks (w) after birth.

