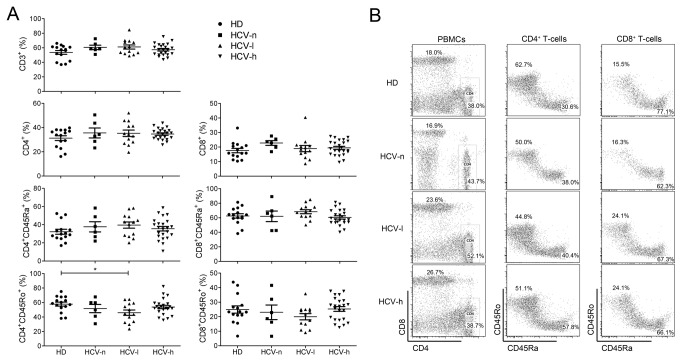
Figure 2. Percentages of T-cells subpopulations in the peripheral blood of CHC patients and HDs.
(A), The percentages of total T-cells (CD3+), CD8+, and CD4+ T-cells in the peripheral blood of patients and HDs. The frequency of memory/activated (CD45RO+) T-cells and naïve (CD45RA+) T-cells among CD8+ or CD4+ T-cells was also determined. (B), Representative FACS profiles of T-cells subsets in the peripheral blood of patients and HDs are shown. *, p<0.05.

