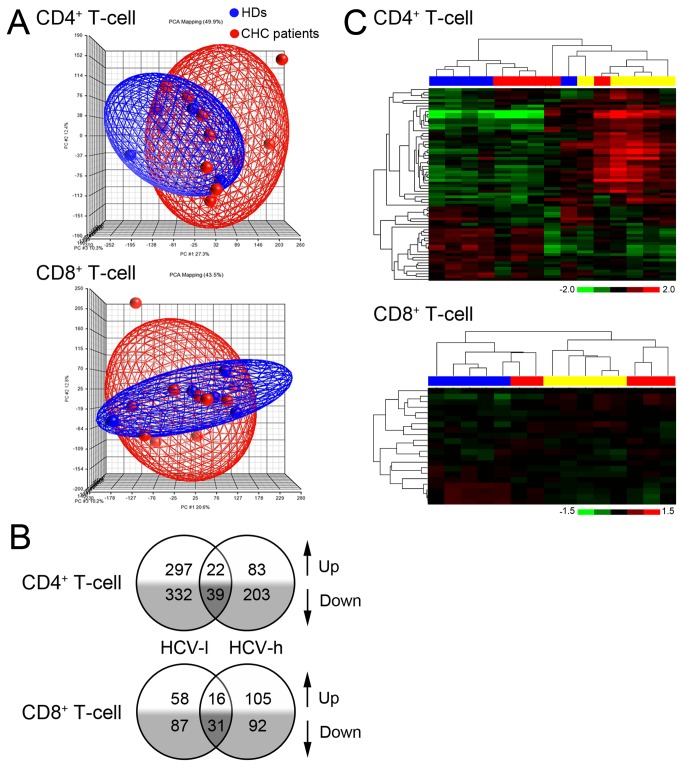
Figure 5. Overall gene expression profiles of CD4+ or CD8+ T-cells from CHC patients.
(A), Scatterplot graph of CD4+ and CD8+ T-cells with PCA (principal component analysis) mapping. CHC patients, n=10; HDs, n=5. (B), The number of genes differentially expressed (fold-change ≥1.5, p<0.05) in CD4+ and CD8+ T-cells of HCV-l and HCV-h group when compared to those in HDs. The microarray data were derived from 5 individuals for each group. The numbers in the overlapping region represent the genes changed in both the HCV-l and HCV-h groups. (C), Clustering analysis of significantly changed apoptosis-related genes in CD4+ and CD8+ T-cells from CHC patients and HDs. Blue blocks represent HDs; yellow blocks represent HCV-l samples; red blocks represent HCV-h samples.

