
Figure 4. Interactions between Pi03192 and StNTP1 or StNTP2 occur at the ER membrane.
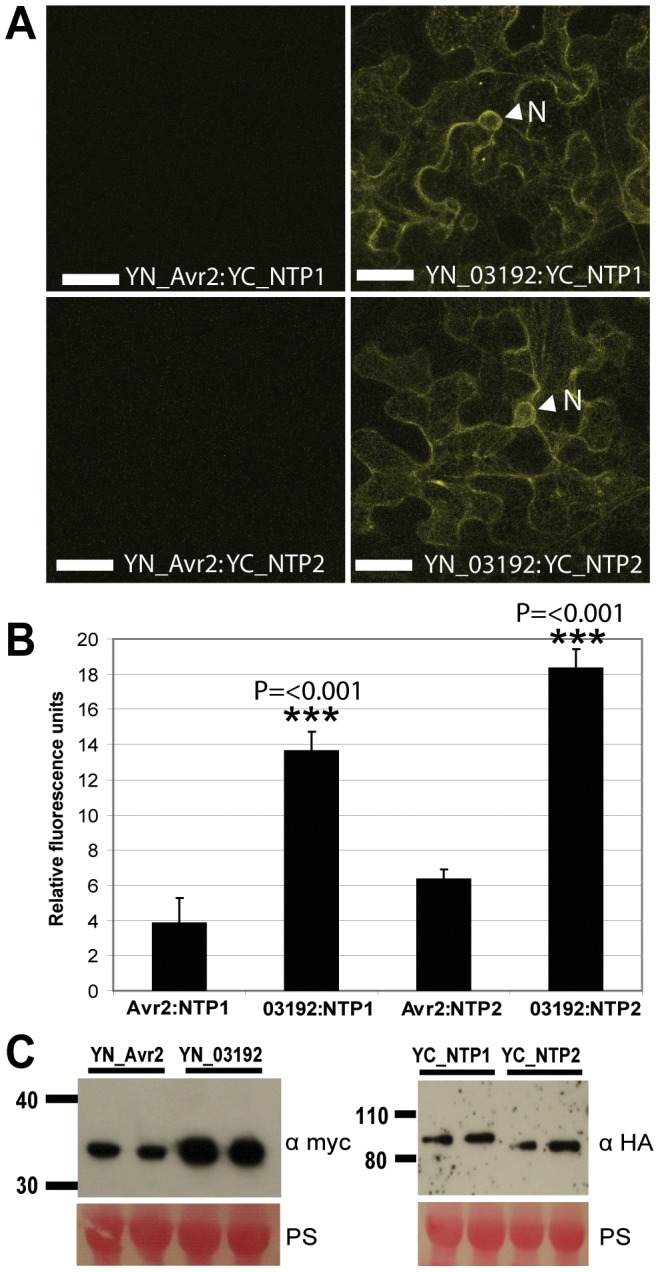
(A) BiFC images showing that YFP fluorescence is reconstituted at the ER when YC-StNTP1 and YC-StNTP2 are co-expressed with YN-Pi03192, but not with YN-Avr2. The arrowheads indicated the ER membrane surrounding the nucleus. Scale bars indicate 35 µm. (B) Graph shows relative fluorescence quantified using a fluorimeter. Error bars show standard error and asterisks indicate a very highly significant difference (p<0.001, t-test) in fluorescence of YC-StNTP1 or YC-StNTP2 co-expressed with YN-Pi03192, compared to co-expression with YN-Avr2. (C) Immunoblots showing stability of full length YN-Pi03192 and YN-Avr2 (myc antibody) fusions and YC-StNTP1 and YC-StNTP2 (HA antibody) fusions.