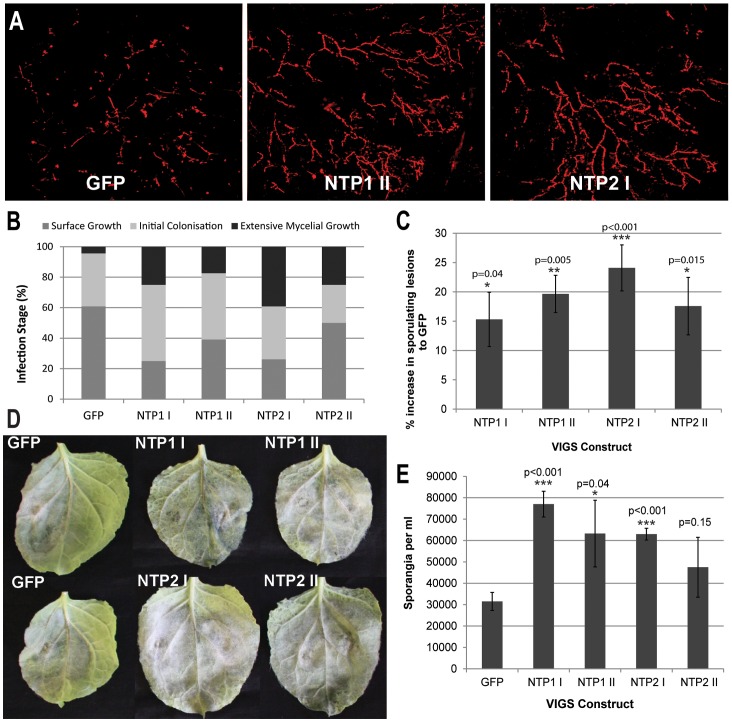
Figure 5. VIGS of NbNTP1 and NbNTP2 increases susceptibility to P. infestans.
(A) Typical confocal images of P. infestans 88069-tdT growth (observed as Td-tomato fluorescence) at 3 dpi in unsilenced (GFP) or silenced (NTP1 II or NTP2 I as examples) for comparison with categories of infection in Figure S7). (B) Graph shows the percentage of P. infestans 88069-tdT infection sites on plants that are unsilenced (GFP) or expressing each VIGS construct (as indicated) which belong to each infection category (surface growth, initial colonisation, extensive mycelial growth) as visualised by confocal microscopy at 3 dpi. The results are combined data for 2 biological reps (n = 8 per construct per rep). (C) Graph shows the percentage increase in the number of inoculation points that are sporulating at 7 dpi, with the levels of sporulation in the GFP control set to zero. Error bars are standard error and the graph represents the combined data from 10 biological reps (n = 32 per construct per rep). Significant differences to the GFP control by t-test are indicated by asterisks and p values. (D) Photographs of leaves from the indicated VIGS plants infected with WT P. infestans at 10 dpi. (E). Sporangia per ml recovered at 10 dpi from each VIGS line. Error bars are standard error and significant difference to the GFP control by t-test are indicated by asterisks and p values.

