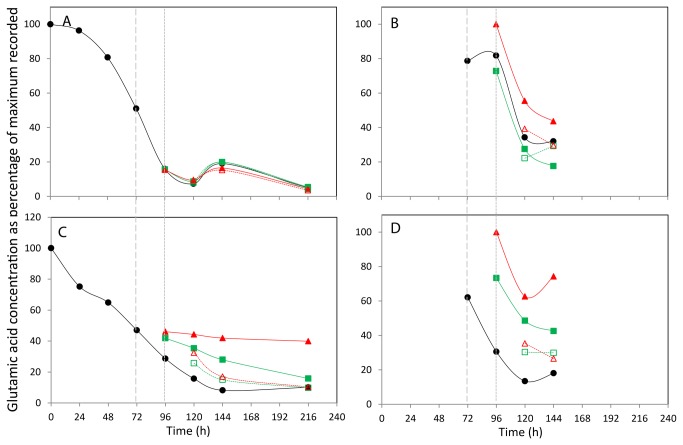
Figure 7. The effect of incubation temperature on extracellular (A+C) and intracellular (B+D) glutamic acid concentration.
The concentration of glutamic acid in CHOK1 (A+B) and CHOS (C+D) media and lysed cells is plotted as percentage of the maximum of each metabolite recorded within the data set. Shift in culture temperatures is denoted by the wide dashed line, and recovered temperature with the short dashed line. Legend: • 37 °C, ■ 27 °C shift, ▲ 10 °C shift, □ 27 °C recover, △ 10 °C recover.

