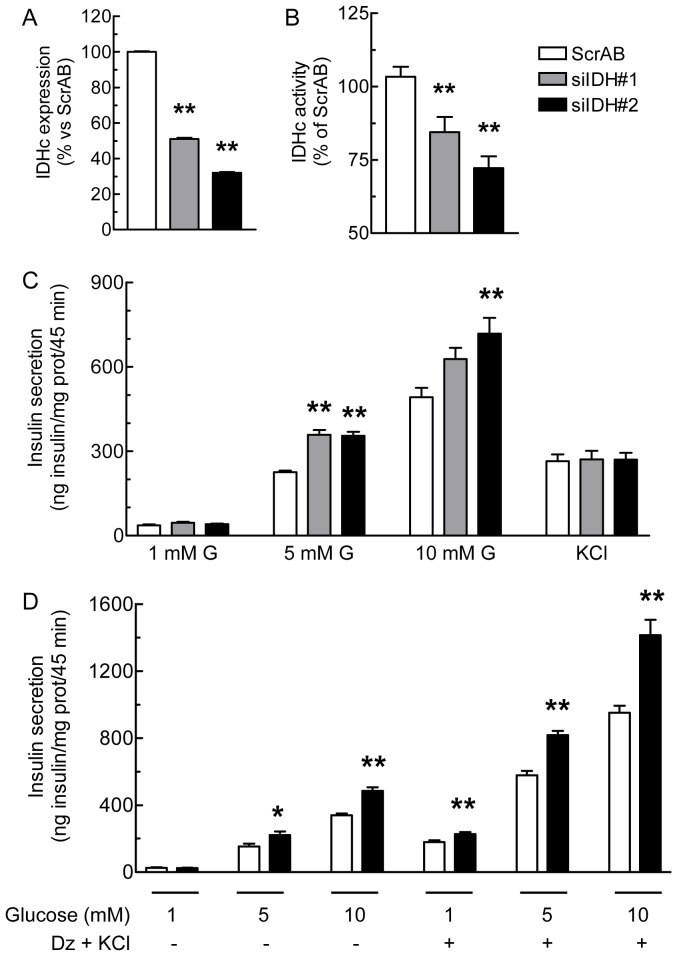
Figure 2. Knockdown of IDHc expression enhances glucose-induced insulin secretion.
INS 832/13 cells were transfected with ScrAB, siIDHc#1 or siIDHc#2. A, IDHc mRNA expression level normalized with cyclophilin mRNA and presented as percentage vs the ScrAB condition. B, Enzymatic activity of IDHc normalized by protein content. C, Insulin secretion. Insulin release was measured in transfected cells incubated at 1, 5 or 10 mM glucose (G) or 1 mM glucose plus 35 mM KCl. D, Assessment of the amplification pathway of glucose-induced insulin secretion. Insulin secretion was measured in transfected cells incubated at 1, 5 or 10 mM glucose ±150 µM diazoxide plus 35 mM KCl (Dz+KCl). Insulin levels were normalized by protein content. Data represent the mean ± SEM of three to four independent experiments performed in quadruplicate. * p<0.05; ** p<0.01, vs ScrAB under the same condition, by one-way Anova, Dunnett's post-test.

