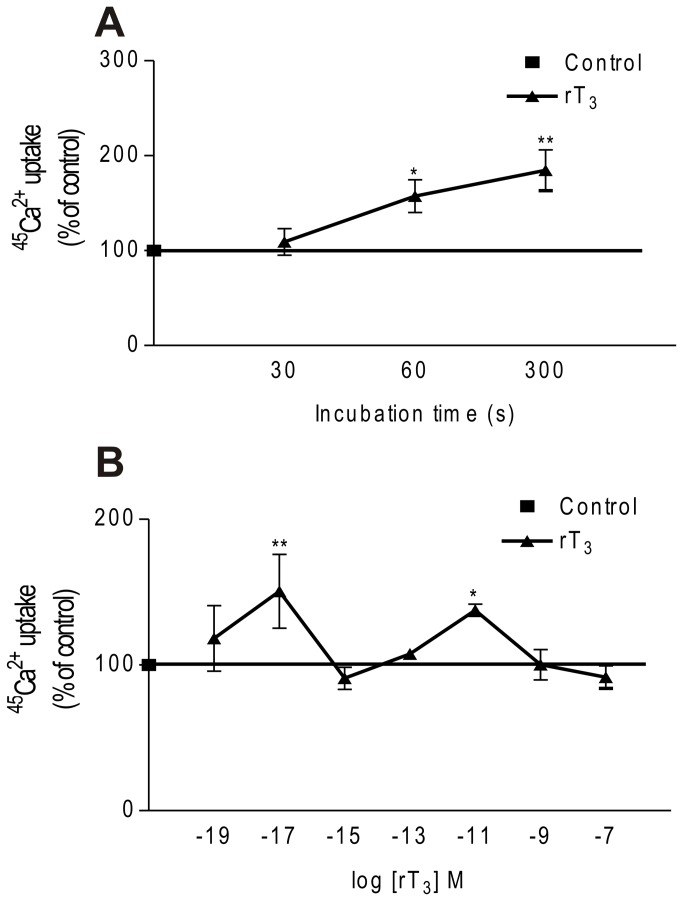
Figure 1. Time-course and dose-response curve of rT3 on Ca2+ uptake in Sertoli cells.
(A) Time-course effect of rT3. Pre-incubation: 15 min in KRb, additional pre-incubation: 60 min with 0.1 µCi/mL of 45Ca2+ and incubation time: 30, 60 and 300 s with 0.1 µCi/mL of 45Ca2+ in the presence or absence of rT3 (10-17 M). Means ± S.E.M. n= 4 for all groups. **P < 0.01 and *p < 0.05 compared with control group. (B) Dose-response curve for rT3 in relation to Ca2+ uptake in Sertoli cells. Pre-incubation: 15 min in KRb, additional pre-incubation: 60 min with 0.1 µCi/mL of 45Ca2+ and incubation time: 60 s with 0.1 µCi/mL of 45Ca2+ in the presence or absence of rT3. Means ± S.E.M. For control and rT3 (10-19, 10-17, 10-15, 10-13, 10-11, 10-9 and 10-7 M), n=4 for each group. **P < 0.01 and *p < 0.05 compared with control group.

