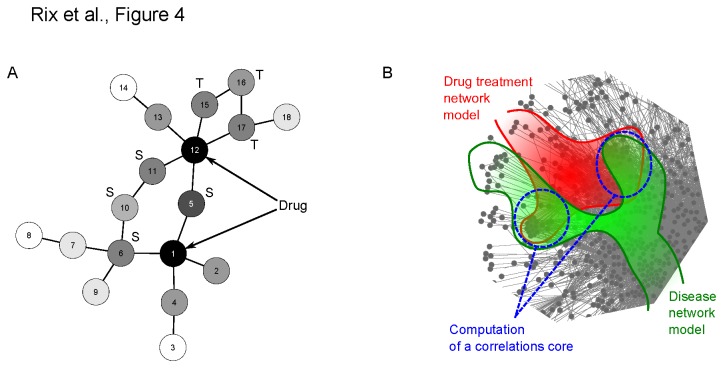
Figure 4. Diffusion and scoring methods.
A. Schematic representation of a diffusion process in a “toy” network. The proteins (nodes) labeled 1 and 12 are drug targets (in practice they could have distinct weights based on the abundance score but here they have the same for simplicity). After completion of the diffusion process, the entire network is assigned probabilities (black=maximum, white=minimum). Nodes close to the targets typically receive higher probabilities and, due to the network topology, synergistic effects are obtained for nodes close to several targets (marked as “S”) or linked in multiple ways to a single target (marked as “T”). B. Principle of scoring illustrated in part of the network: two diffusion processes are performed separately on the PPI network (partially featured): one yields a model of the drug treatment effect (red) and the second one yields a model of the influence of the disease (green). Combining the two set of scores allows for the computation of a correlation score (blue) that measures the adequacy of a drug treatment for a disease.

