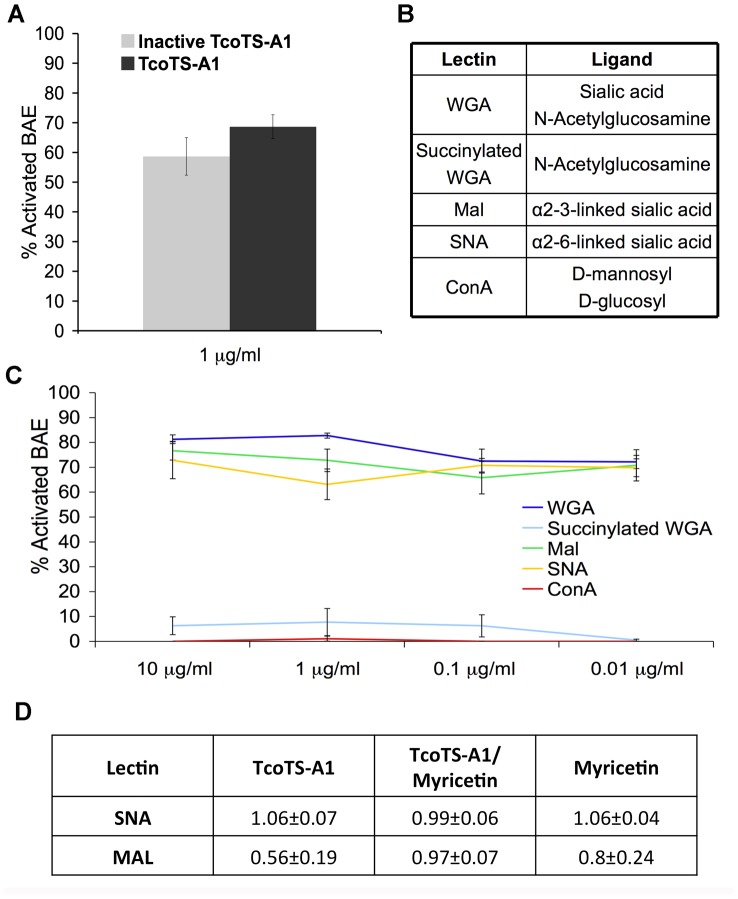
Figure 8. Involvement of TS lectin domain and α-2,3 linked sialic acids in BAE activation.
(A) Effect of inactivation of catalytic site of TcoTS-A1 on BAE activation. 10 µg/ml of the active and inactive TcoTS-A1 were incubated for 16 h with BAE. (B) Ligand binding specificity of the lectins. (C) Activation of BAE by the lectins WGA, Mal, SNA, ConA and succinylated WGA after 16 h of incubation. Lectin concentration is indicated on the X-axis. (D) Competitive effect of TcoTS-A1 on MAL binding to BAE. Ratios of median fluorescence intensity (MFI) of BAE in the presence of TcoTS-A1, Myricetin or TcoTS-A1 pre-incubated with myricetin, over MFI of BAE with SNA-FITC or MAL-fluorescein alone. Data are expressed as mean values±SD of three independent experiments.

