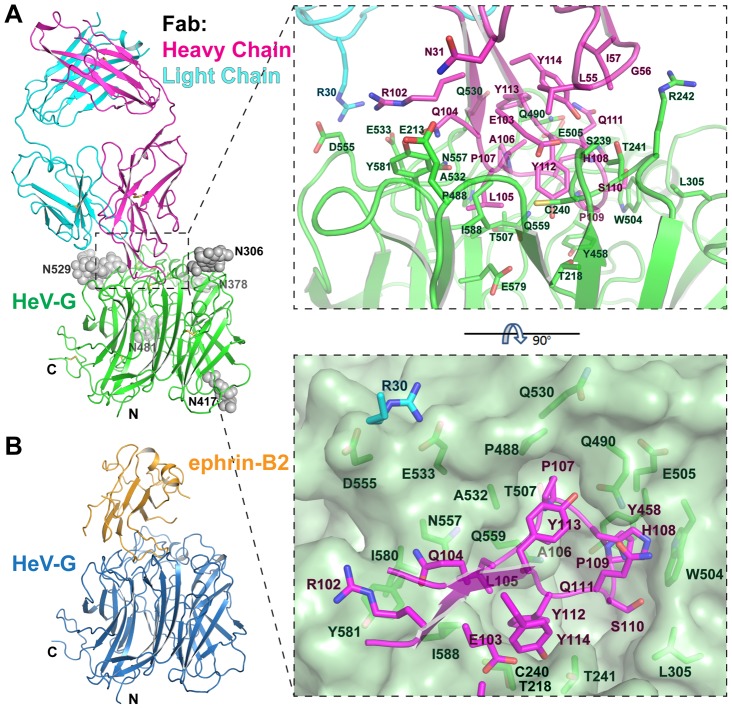
Figure 1. Structure of the m102.3/HeV-G complex, and comparison to the ephrin-B2/HeV-G structure.
A. Left: Overall Structure of the m102.3/HeV-G complex viewed from the side. CDR-H3 (magenta) of m102.3 inserts into the central cavity of HeV-G (green). Disulfide bonds are shown as yellow sticks. The five glycosylation sites of HeV-G are shown as grey spheres. Right: A close up view of the HeVG/m102.3 complex interface. Residues involved in the interaction are shown as stick figures and labeled. The solvent accessible surface of HeV-G central cavity region, viewed from top, is presented on the bottom. CDR-H3 residues (magenta) and R30 (cyan, on the light chain of Fab) and their contacting residues on HeV-G (green) are shown and labeled. B. Overall structure of the ephrin-B2 (orange)/HeV-G (blue) complex. HeV-G in the complex is in the same orientation as in panel A.

