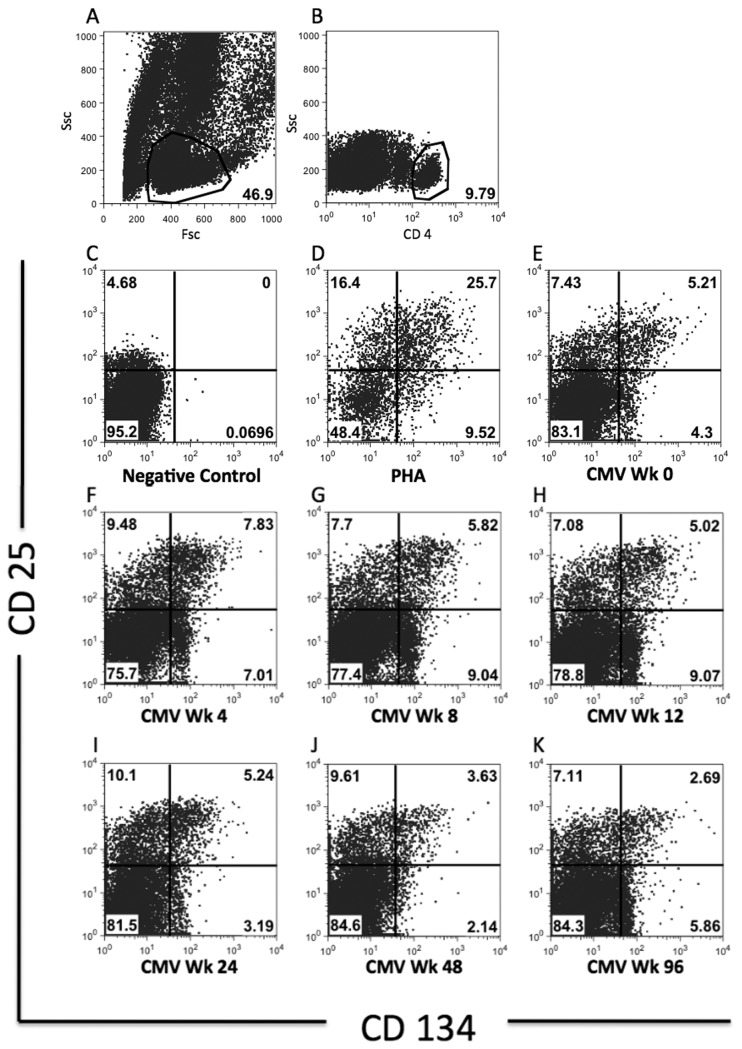
Figure 1. Gating strategies for CMV-SP-CD4 T cells.
All flow cytometry plots are from a single subject of the RESTORE study. Lymphocytes were identified using forward and side scatter (Figure 1A), followed by gating on CD4+ T cells (Figure 1B). Gates for CD25+ and CD134+ cells were placed based on comparison with negative control (Figure 1C) and PHA positive control (Figure 1D) to include cells highly co-expressing CD25 and CD134. A representative example of the dynamics of responses to CMV antigens over 96 weeks of follow-up in a RESTORE subject (Figure 1E-K).

