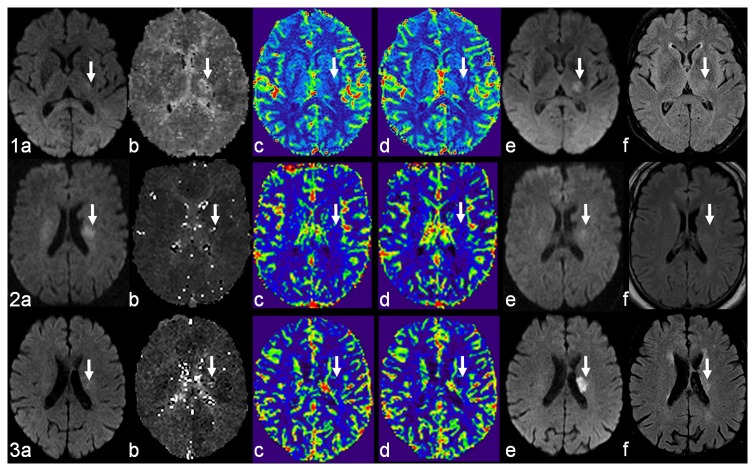
Figure 1. Three examples of perfusion patterns in acute lacunar infarction.
Mismatch (1), inverse mismatch (2), and match (3) between diffusion-weighted and perfusion-weighted images (DWI, PWI). DWI (a) shows the initial ischemic lesion (white arrow). PWI derived maps demonstrate the perfusion deficit: time to peak (b), cerebral blood flow (c), and cerebral blood volume (d). Follow-up DWI (e) and FLAIR (f) show the ischemic lesion (white arrow). Note that case 2 is also an example of lesion reversal after intravenous thrombolysis.

