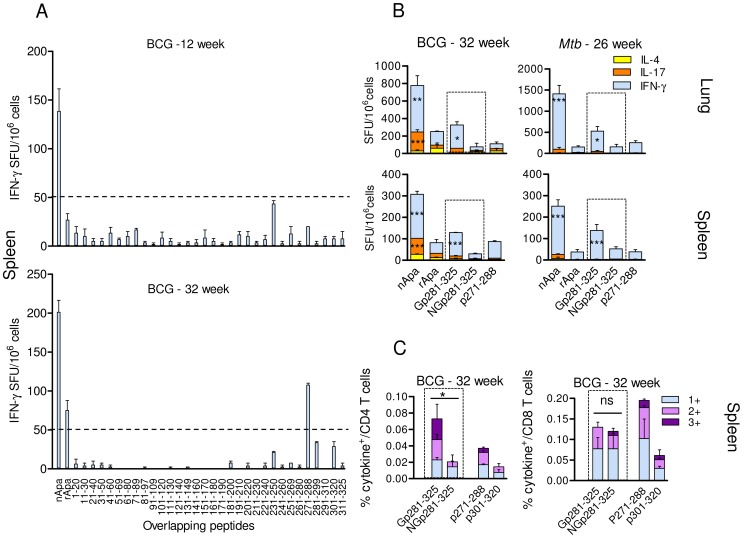
Figure 3. T cell reactivity to in vitro-mannosylated rApa C-terminal.
(A) Pooled splenocytes from BCG infected mice (n = 4) were stimulated in vitro with nApa, rApa or 32 individual non-glycosylated synthetic Apa peptides in ELISPOT assay. IFN-γ SFU/106 cells at 12 and 32 wk time points are shown. (B–C) Synthetic C-terminal glycopeptide (Gp281-325)- or control non-glycopeptide (NGp281-325)-specific T cell response (indicated inside dotted box) in mice. Stimulation with proteins (nApa or rApa) or non-glycopeptides (p271-288 or p301-320) was also included as controls. (B) Ag- or peptide-specific IFN-γ, IL-17 or IL-4 SFU/106 pooled lung or spleen cells of BCG or Mtb infected mice at 32 and 26 wks, respectively. (C) The proportions of peptide-specific 1+, 2+ and 3+ cytokine producing T cell subsets constituting total cytokine positive (+) CD4+ T cells in the spleen of BCG infected mice at 32 wks, expressed as % of CD4+ T cells. Data in A–C are means ± s.e.m. *Significant using 1-way ANOVA followed by Bonferroni's test.

