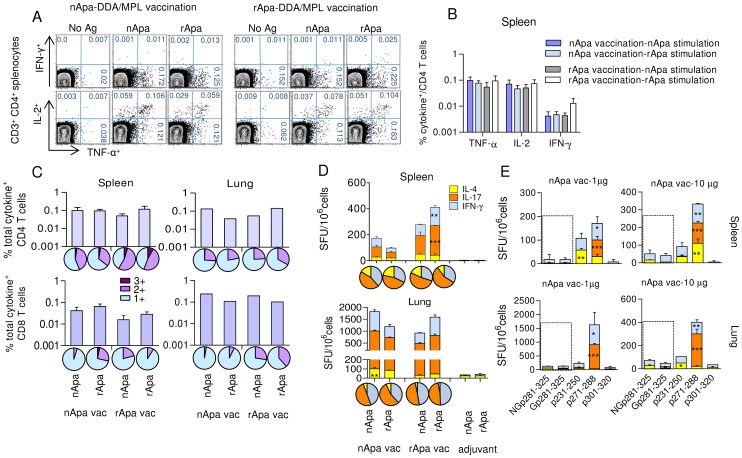
Figure 4. T cell responses in nApa or rApa vaccinated mice.
(A–D) Mice were vaccinated with nApa or rApa in DDA-MPL adjuvant or with adjuvant alone (controls), and their spleen or lung cells were stimulated in vitro with no Ag, nApa or rApa 1 wk after last vaccination. (A) The percentages (%) of TNF-α and IFN-γ (top) or IL-2 (bottom) producing cells among splenic CD4 T cells of 1 representative mouse from nApa or rApa vaccinated group are shown, and (B) the frequency (%) of nApa- or rApa-specific individual cytokine producing cells among splenic CD4+ T cells from 4 mice/vaccinated group is plotted ( means ± s.e.m.). (C) The frequency (%) of nApa- or rApa-specific total cytokine producing cells among CD4+ (top) and CD8+ (bottom) T cells from the spleen (means ± s.e.m., n = 4 mice/group) and lung (pools) of nApa or rApa vaccinated (vac) mice. The corresponding pie charts present the mean frequencies of 1+, 2+ and 3+ cytokine producers. (D) The frequency of nApa- or rApa-specific IFN-γ, IL-17 or IL-4 SFU/106 spleen or lung cells of vaccinated (vac) and control mice. The corresponding pie charts present the mean cytokine frequencies. Data are means ± s.e.m. of 3–4 wells using pooled cells. The responses of 2 Apa vaccinated groups were compared. *Significant by 1-way ANOVA followed by Bonferroni's test comparing respective immunogen-specific responses. (E) Synthetic Gp281-325- or NGp281-325-specific cytokine response of nApa vaccinated mice 4 wks post-vaccination. Stimulation with p231-250, p271-288 or p301-320 was evaluated for comparison.

