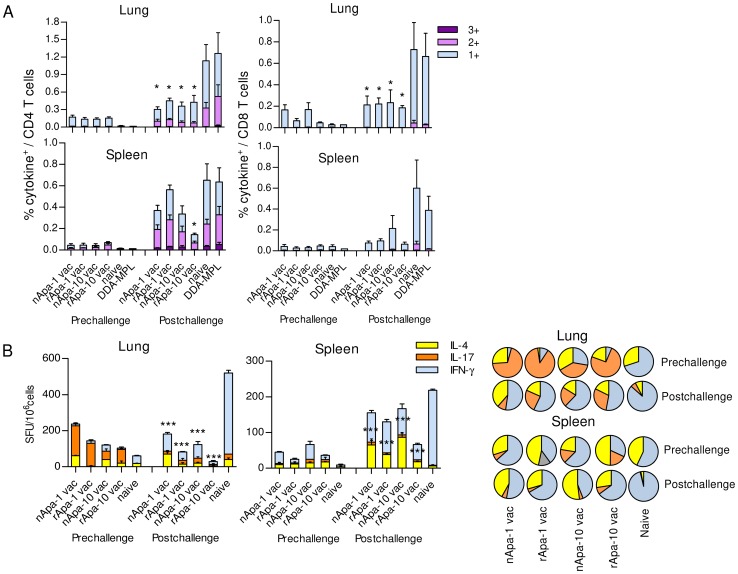
Figure 7. Pathogen-specific responses in Apa vaccinated and control mice after challenge.
(A) The proportions of STCF-specific 1+, 2+ and 3+ cytokine producers (of IFN-γ, TNF-α and IL-2) constituting STCF-specific total cytokine positive (+) CD4+ or CD8+ T cells are plotted as % of CD4+ T cells or CD8+ T cells in the lung and spleen of Apa vaccinated and control mice. Data are means ± s.e.m. of 4 mice/group. (B) The frequency of STCF-specific IFN-γ, IL-17 or IL-4 SFU/106 pooled spleen or lung cells of vaccinated and control mice. Data are means ± s.e.m. of 3 wells. The corresponding pie charts present mean cytokine frequencies. *Significant by 1-way ANOVA followed by Bonferroni's test comparing responses of each vaccinated group with adjuvant control group post-challenge.

